Question 26
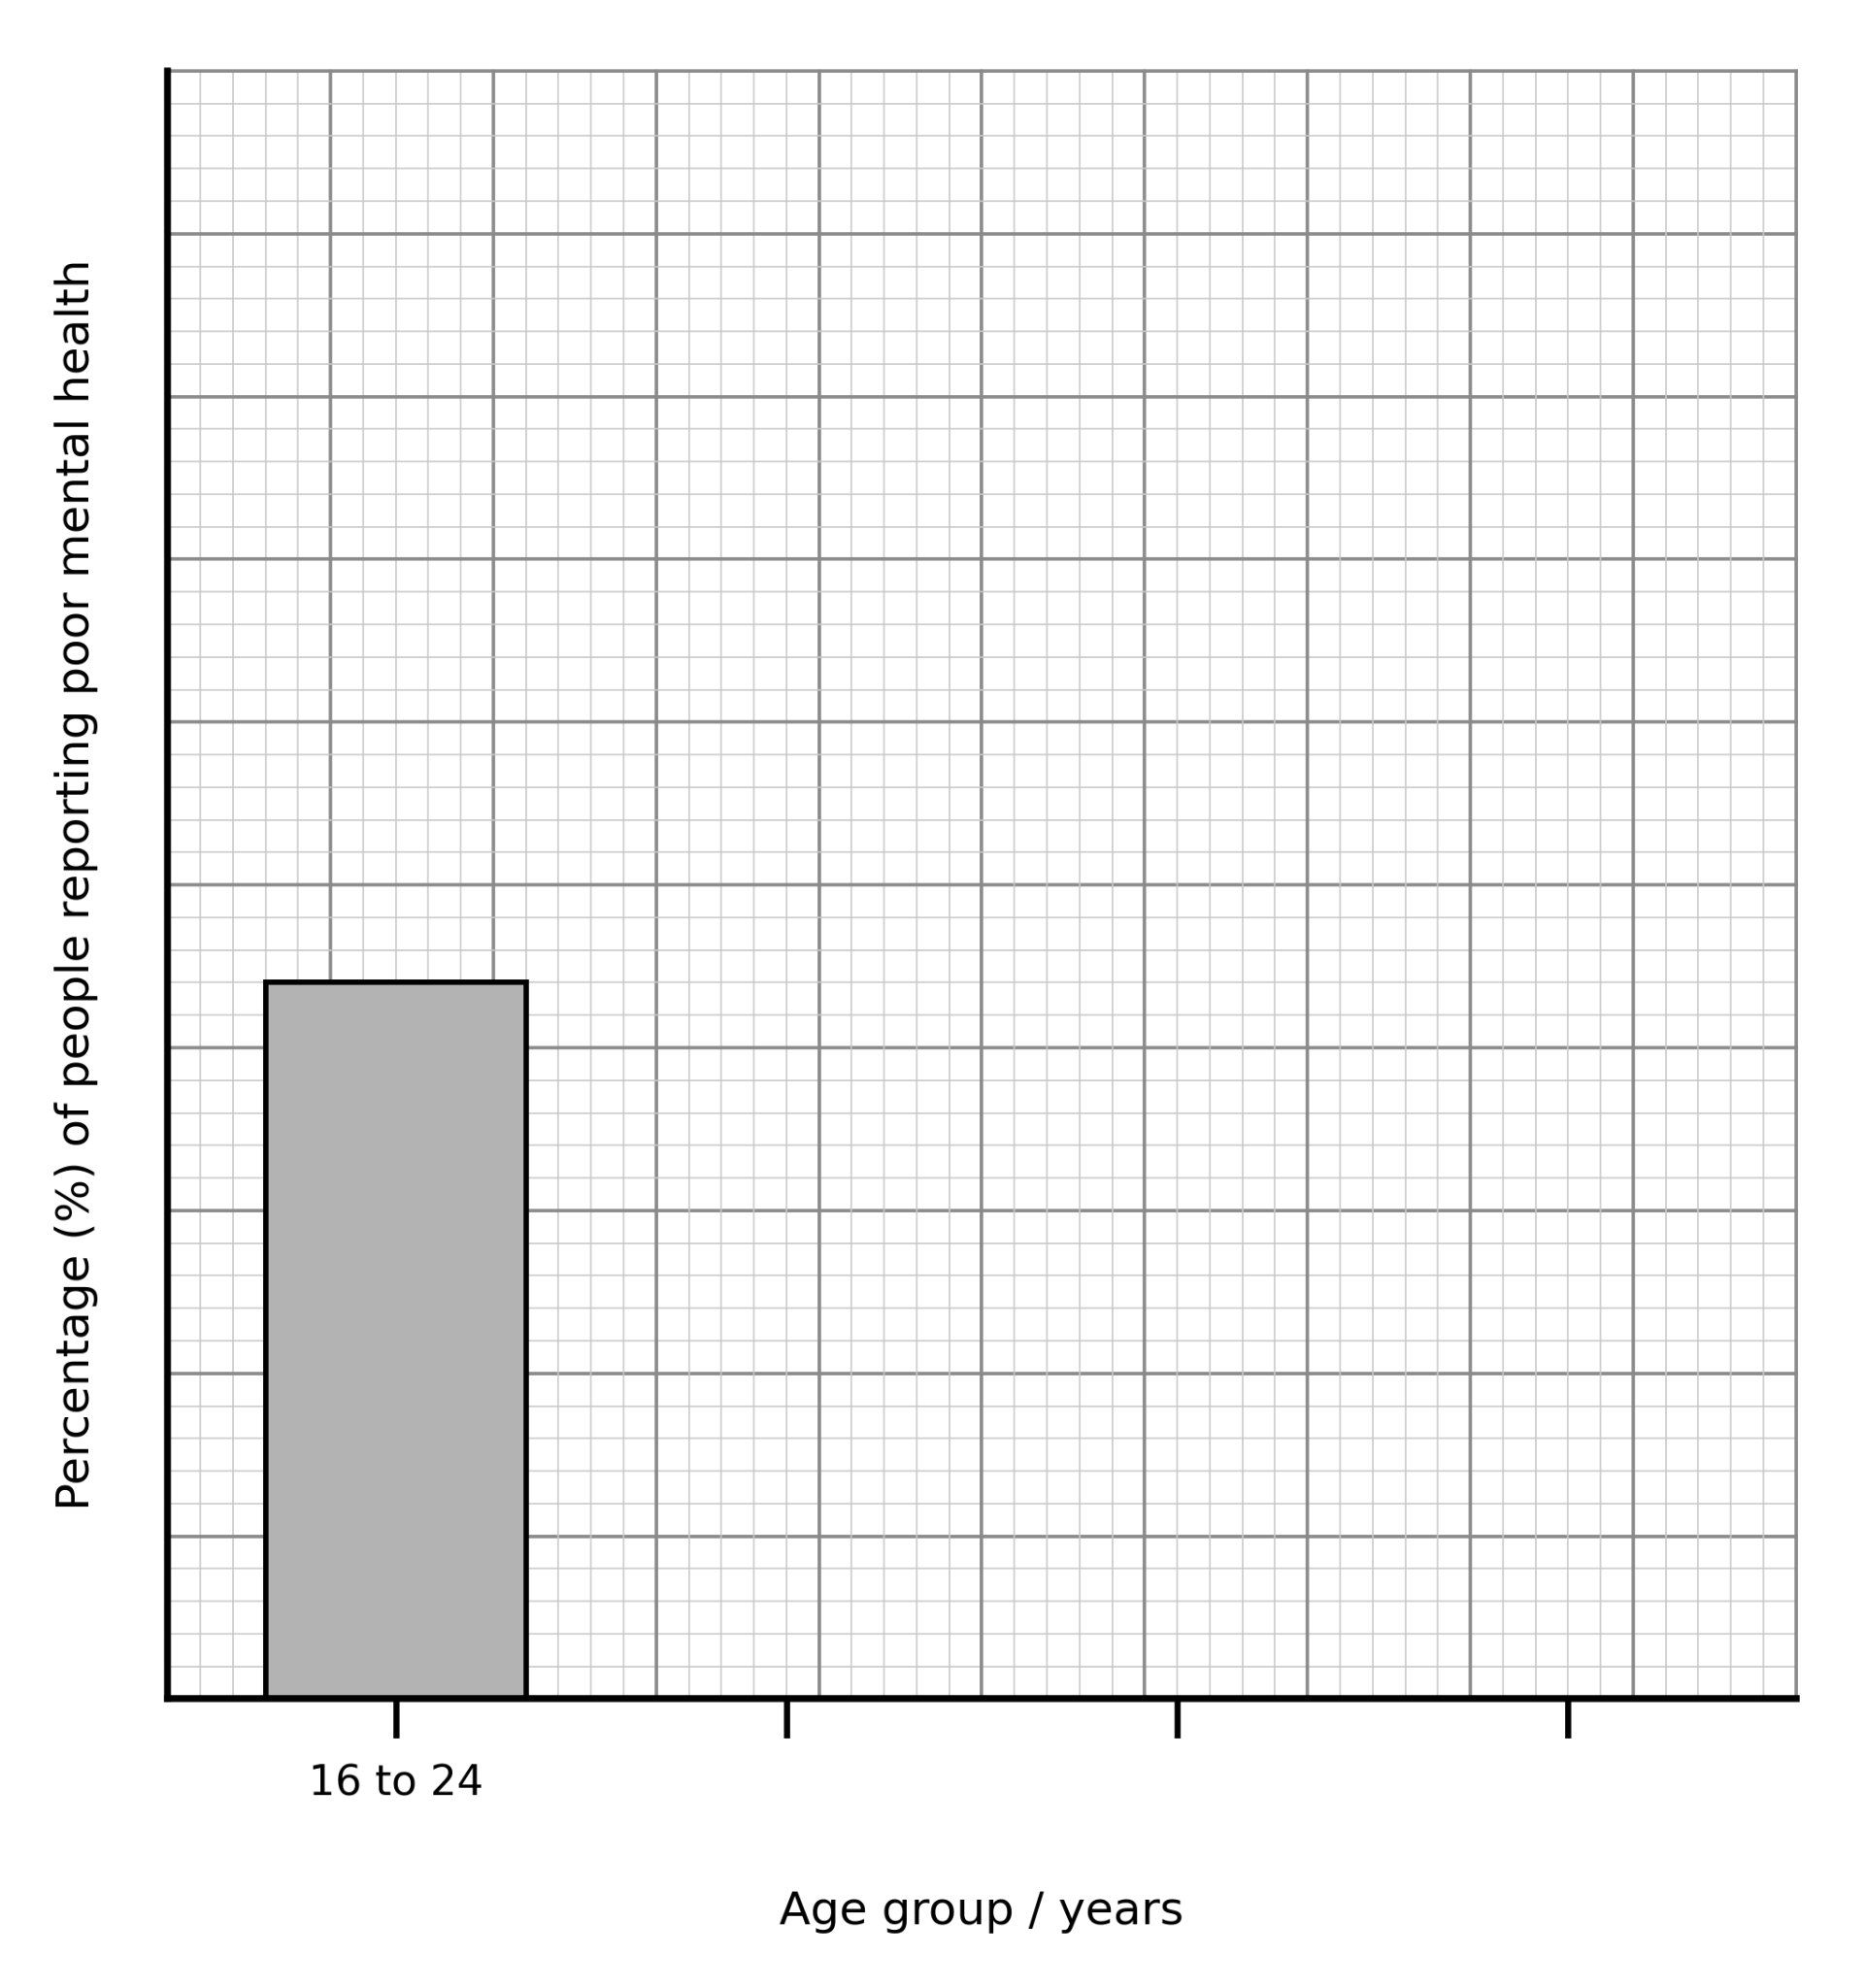
FScientists sent a questionnaire to people in four age groups. They recorded the percentage of people in each age group who reported poor mental health. The table shows their results.
Table: The percentage of people in four age groups who reported poor mental health
| Age group / years | Percentage (%) of people reporting poor mental health |
|---|---|
| :---: :---: | |
| 16 to 24 | 22 |
| 25 to 44 | 18 |
| 45 to 64 | 15 |
| 65 and over | 11 |
Figure: Grid for plotting the data in the table
a.[3]
Complete the figure. You should:
- add a suitable scale to the y-axis
- plot the remaining three bars
- label each of these three bars.
The bar for the 16 to 24 age group has been plotted for you.
b.[1]
Describe the pattern shown by the completed figure.
c.[1]
The scientists sent the questionnaire to 200 people in each age group.
Give one reason why their results may not represent the whole population.
2.2 Animal tissues, organs and organ systems Questions
179 exam-style questions on AQA GCSE Biology 2.2 Animal tissues, organs and organ systems, covering 2.2.1 The human digestive system, 2.2.2 The heart and blood vessels, 2.2.3 Blood, 2.2.4 Coronary heart disease: a non-communicable disease, 2.2.5 Health issues, 2.2.6 The effect of lifestyle on some non-communicable diseases, and 2.2.7 Cancer. Each one has a worked solution and a mark scheme showing where the marks go.