Question 4
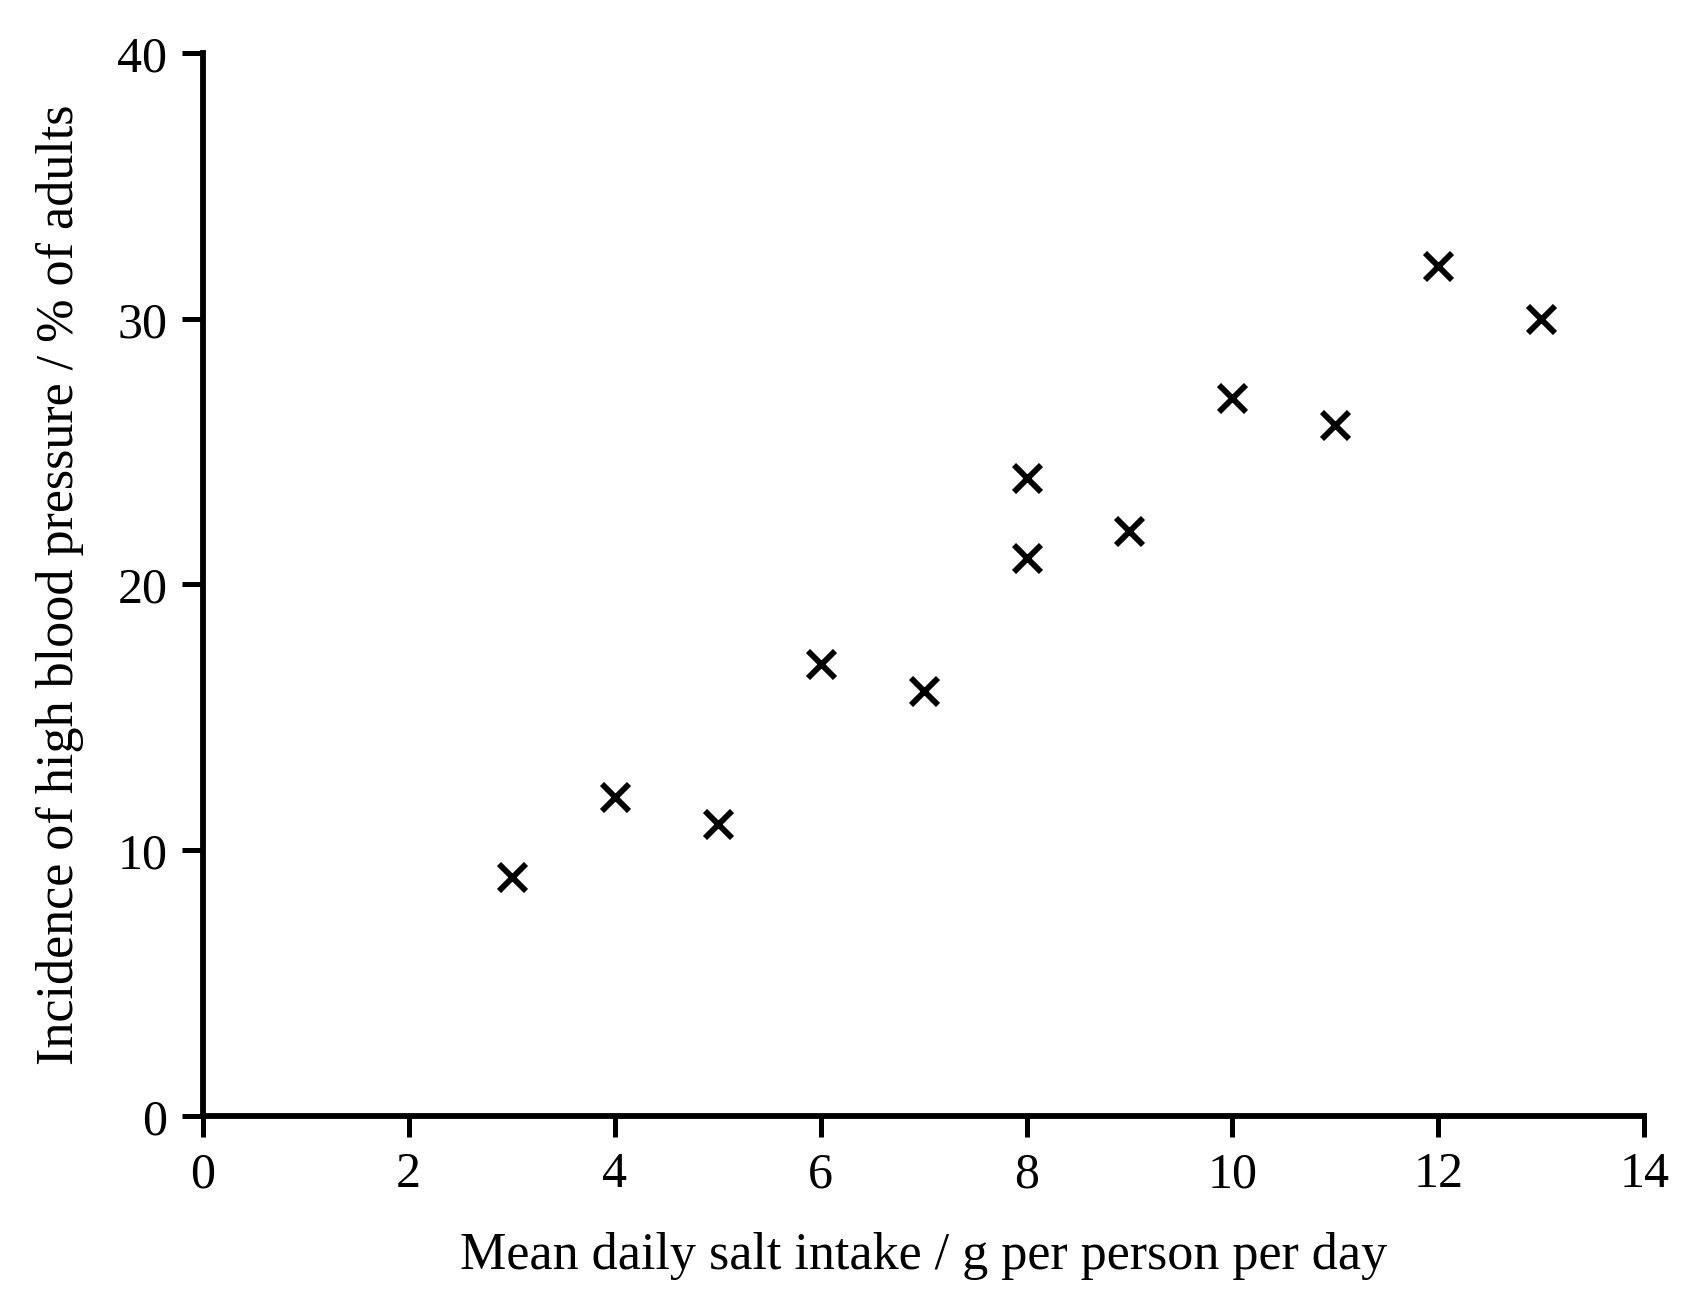
FA scientist investigated whether there is a link between the amount of salt people eat and high blood pressure. For each of 12 countries she recorded the mean daily salt intake and the incidence of high blood pressure.
Figure: Scatter diagram of the incidence of high blood pressure against the mean daily salt intake for twelve countries
a.[1]
Describe the correlation shown in the figure.
b.[2]
A newspaper reported the study with the headline 'Eating salt causes high blood pressure'.
Explain why the data in the figure do not show that eating salt causes high blood pressure.
c.[1]
Suggest one way the scientist could get stronger evidence that eating salt affects blood pressure.
2.2 Animal tissues, organs and organ systems Questions
179 exam-style questions on AQA GCSE Biology 2.2 Animal tissues, organs and organ systems, covering 2.2.1 The human digestive system, 2.2.2 The heart and blood vessels, 2.2.3 Blood, 2.2.4 Coronary heart disease: a non-communicable disease, 2.2.5 Health issues, 2.2.6 The effect of lifestyle on some non-communicable diseases, and 2.2.7 Cancer. Each one has a worked solution and a mark scheme showing where the marks go.