Question 5
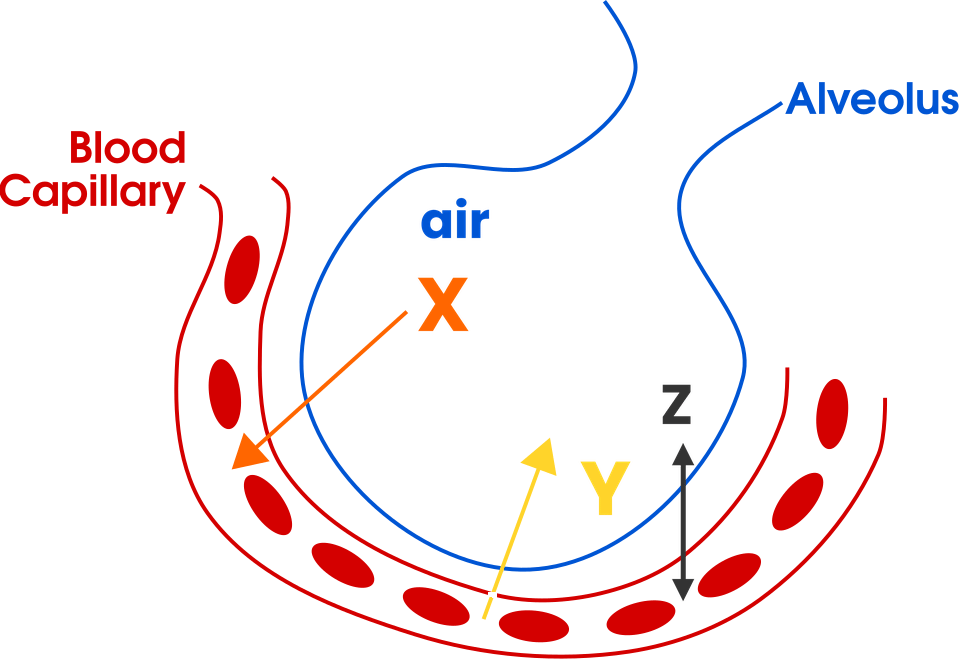
FFigure shows one alveolus and the capillary next to it.
Figure: One alveolus and the capillary beside it, showing two gases moving across the walls
a.[1]
Name the gas moving in the direction of arrow X.
b.[2]
Explain why the gas shown by arrow Y moves out of the blood and into the alveolus.
c.[2]
Distance Z is very short. Explain how this increases the rate of gas exchange.
2.2 Animal tissues, organs and organ systems Questions
179 exam-style questions on AQA GCSE Biology 2.2 Animal tissues, organs and organ systems, covering 2.2.1 The human digestive system, 2.2.2 The heart and blood vessels, 2.2.3 Blood, 2.2.4 Coronary heart disease: a non-communicable disease, 2.2.5 Health issues, 2.2.6 The effect of lifestyle on some non-communicable diseases, and 2.2.7 Cancer. Each one has a worked solution and a mark scheme showing where the marks go.