Resistance and circuit components

EasyMediumHard
1234567891011121314151617181920212223242526272829303132333435363738394041424344454647484950515253545556575859606162636465
Question 62
Easy

Figure 1 shows a graph of resistance against length for a sample of constantan wire.
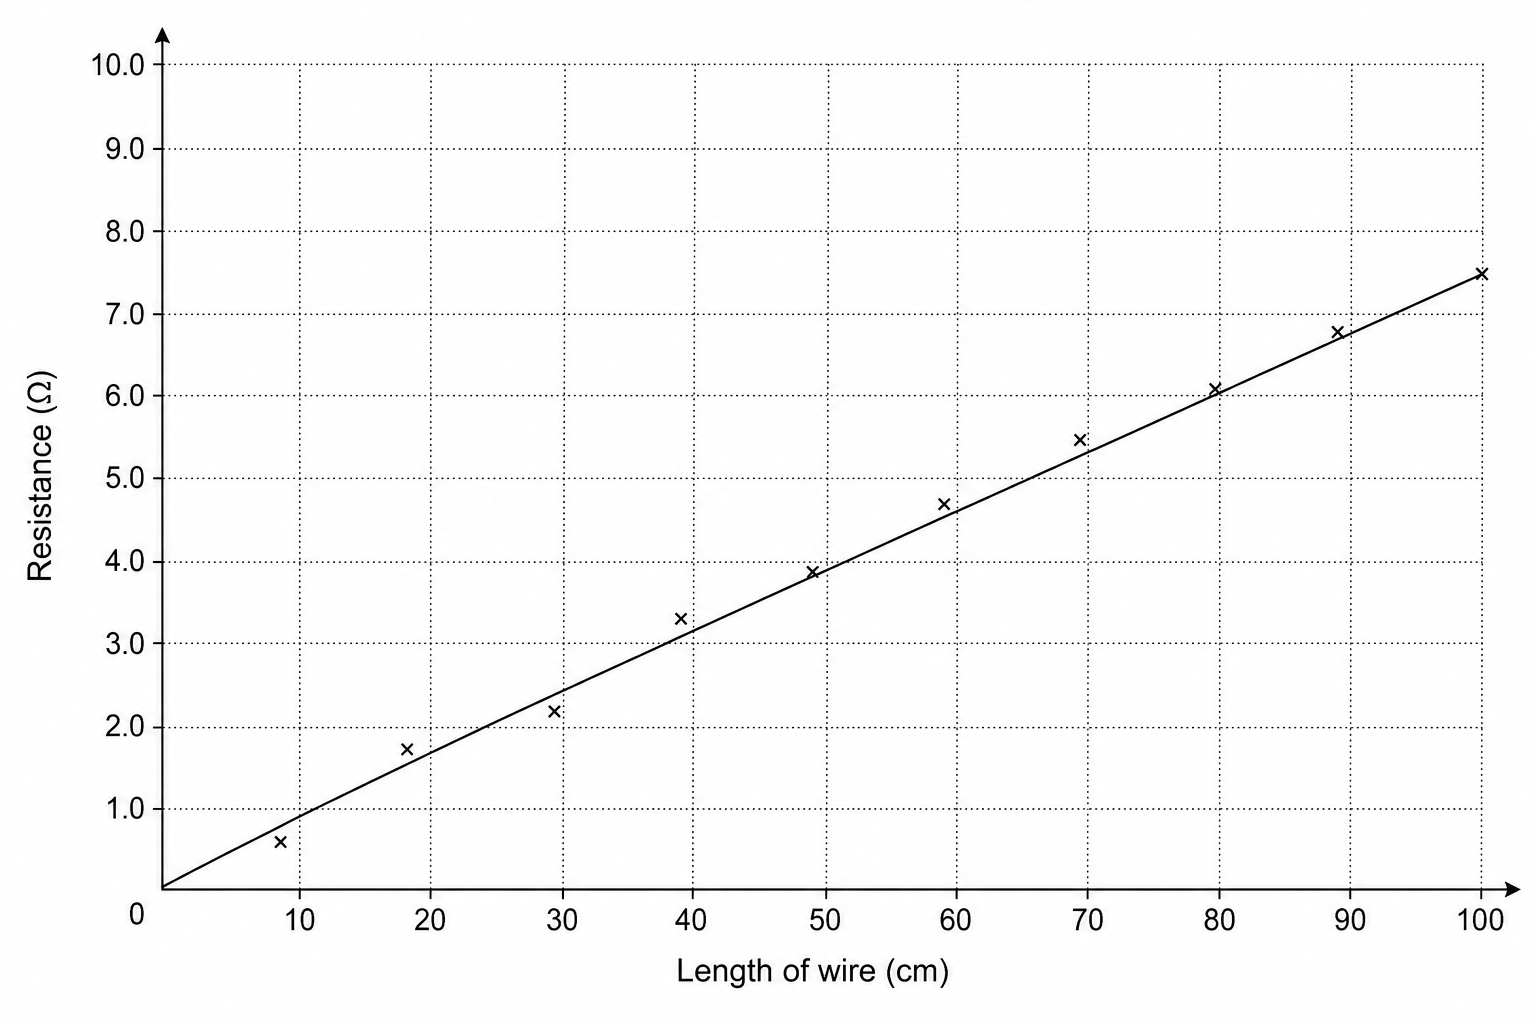
A scatter plot titled 'Resistance vs Length for Constantan Wire'. The horizontal axis is 'Length of wire (cm)' ranging from 0 to 100 with major grid lines every 10 cm. The vertical axis is 'Resistance (Ω)' ranging from 0 to 10.0 with major grid lines every 1.0 Ω. A straight line of best fit passes through the origin (0,0) and coordinates (20, 1.5), (40, 3.0), (60, 4.5), (80, 6.0), and (100, 7.5). Ten slightly scattered individual data points are plotted near this line of best fit.

Use Figure 1 to estimate the resistance of a 90 cm length of this constantan wire.

[1]

Resistance and circuit components Questions

  1. GCSE
  2. /Physics
  3. /Resistance and circuit components