An engineer investigates how the resistance of a negative temperature coefficient (NTC) thermistor varies with temperature. The results of the investigation are plotted on the graph below.
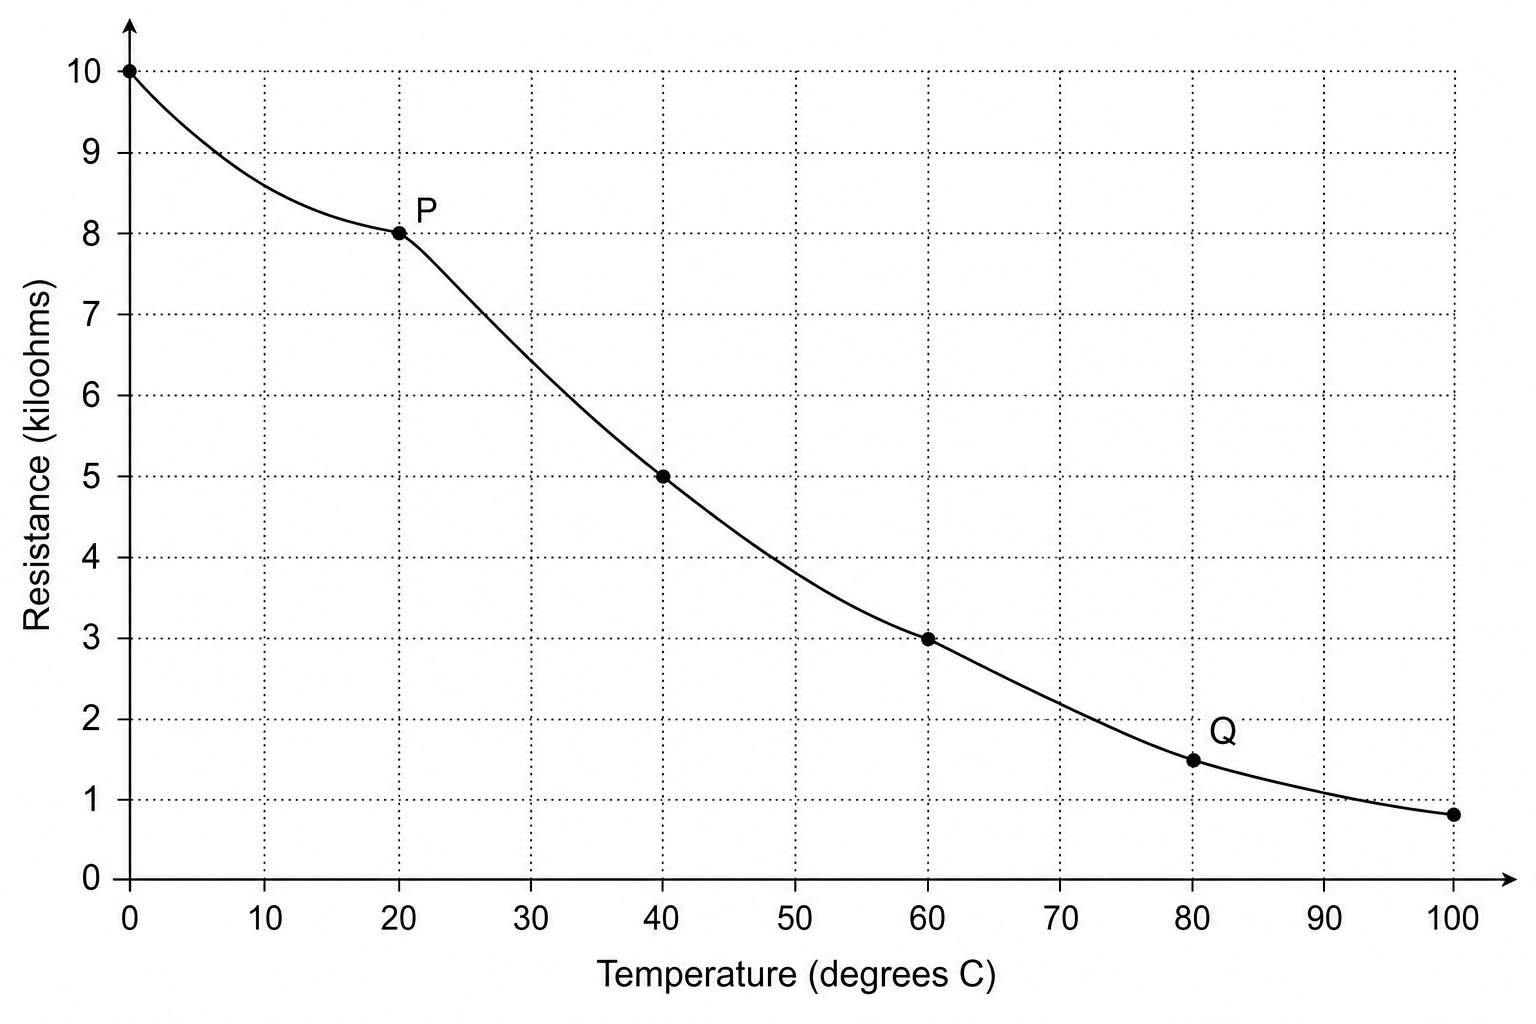
Use the values of temperature and resistance at Point P and Point Q on the graph to complete the table below.
| Point | Temperature (∘C^\circ\text{C}∘C) | Resistance (kΩ\text{k}\OmegakΩ) |
|---|---|---|
| P | (i) .................... | 8.0 |
| Q | 80 | (ii) .................... |