Resistance and circuit components

EasyMediumHard
1234567891011121314151617181920212223242526272829303132333435363738394041424344454647484950515253545556575859606162636465
Question 58
Easy

A student investigates how the resistance of a metal wire changes with its length. Figure 1 shows a graph of the student's results.
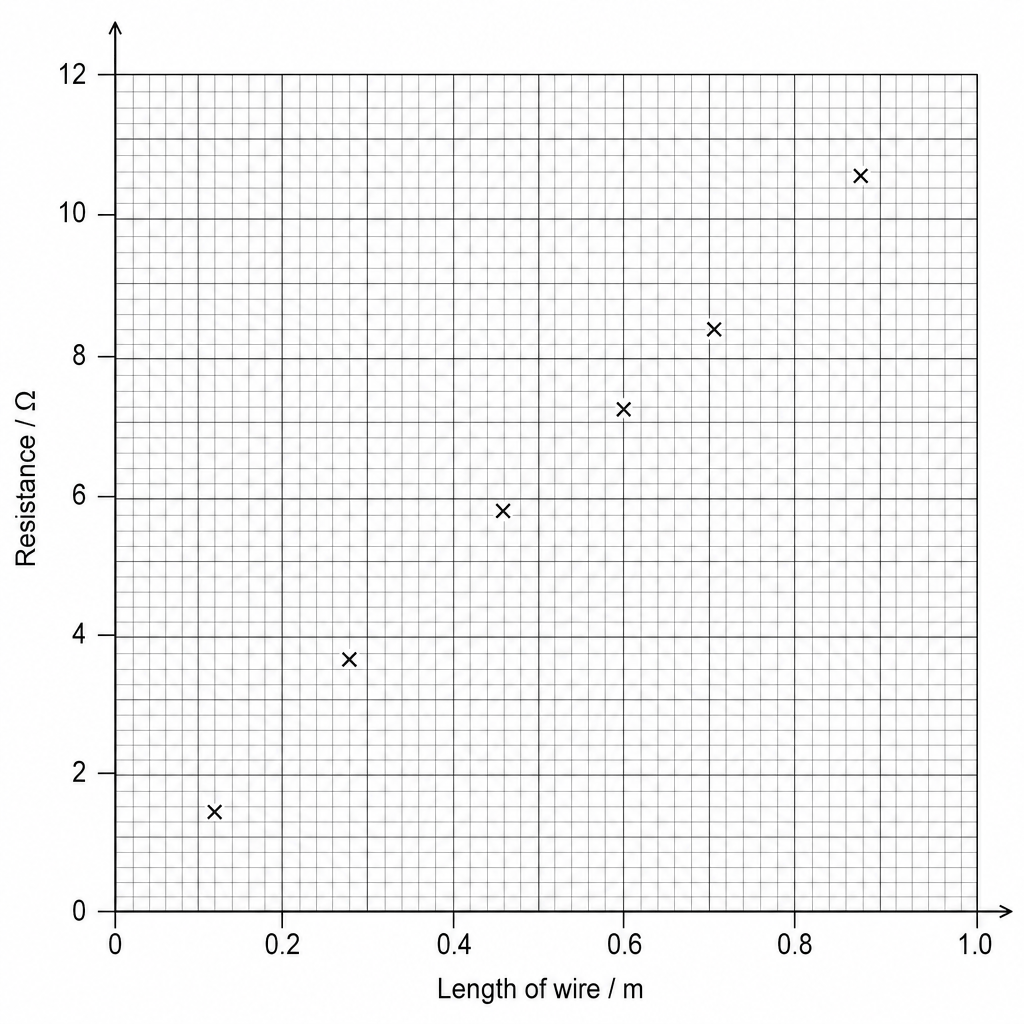
Figure 1: A graph showing Resistance in ohms (Ω) on the vertical y-axis ranging from 0 to 12 with major grid lines every 2 units, and Length of wire in meters (m) on the horizontal x-axis ranging from 0 to 1.0 with major grid lines every 0.2 units. Six data points are plotted as small 'x' marks at approximately the following coordinates: (0.12, 1.4), (0.30, 3.6), (0.48, 5.8), (0.70, 8.4), (0.88, 10.6). All plotted points follow a strong, positive linear trend starting near the origin.

Draw a straight line of best fit on Figure 1.

[1]

Resistance and circuit components Questions

  1. GCSE
  2. /Physics
  3. /Resistance and circuit components