Resistance and circuit components

EasyMediumHard
1234567891011121314151617181920212223242526272829303132333435363738394041424344454647484950515253545556575859606162636465
Question 40
Easy

A student investigates how the total resistance of a circuit changes as more identical resistors are connected in parallel.

Figure 1 shows the results of this investigation.
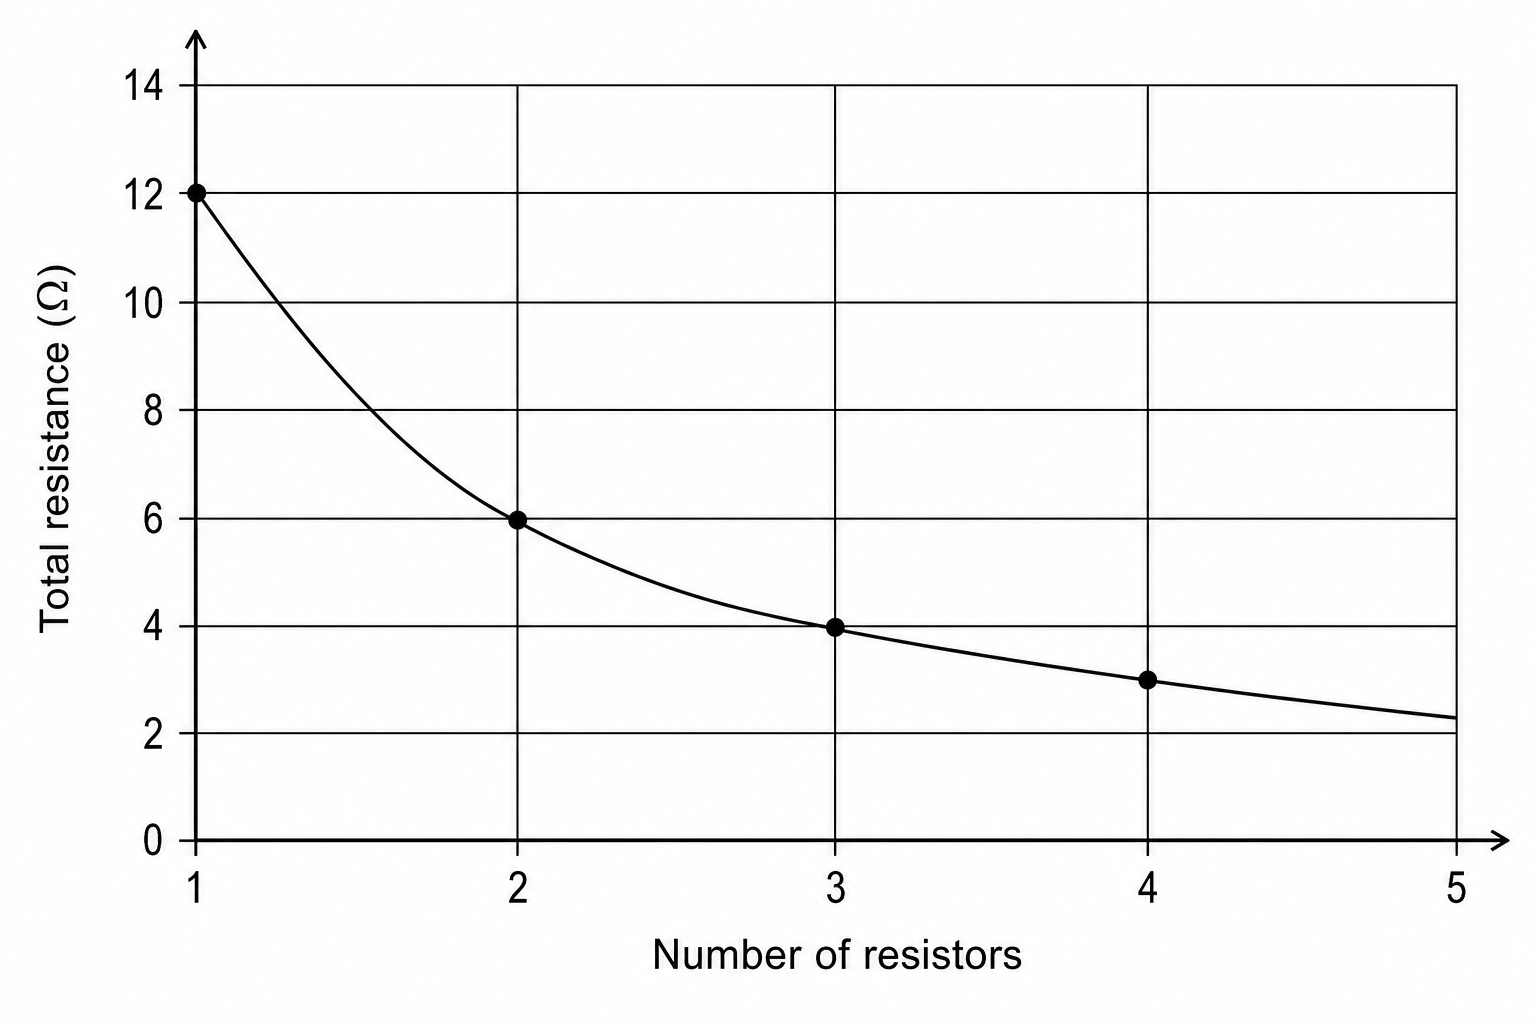
A scatter plot showing total resistance in ohms against the number of resistors connected in parallel. The x-axis is labeled 'Number of resistors' and has grid lines at integer values 1, 2, 3, 4, and 5. The y-axis is labeled 'Total resistance (ohms)' and ranges from 0 to 14, with grid lines every 2 ohms. Four data points are plotted: at 1 resistor, the total resistance is 12 ohms; at 2 resistors, the total resistance is 6 ohms; at 3 resistors, the total resistance is 4 ohms; at 4 resistors, the total resistance is 3 ohms. A smooth curve of best fit connects these points, decreasing from a value of 12 ohms at 1 resistor.

State the resistance of a single resistor.

[1]

Resistance and circuit components Questions

  1. GCSE
  2. /Physics
  3. /Resistance and circuit components