Skip to content
MathsGenie logo
Open app

Course home

  1. GCSE
  2. Biology Edexcel
  3. Question bank

Antibiotics, culturing microorganisms and monoclonal antibodies

EasyMediumHard
123456789101112131415161718192021222324252627282930313233343536373839404142434445464748495051525354555657585960616263646566
Question 66

Figure 1 shows how the turbidity (measured as optical density) of a yeast culture changes over time. The yeast population increases exponentially during the active growth phase.
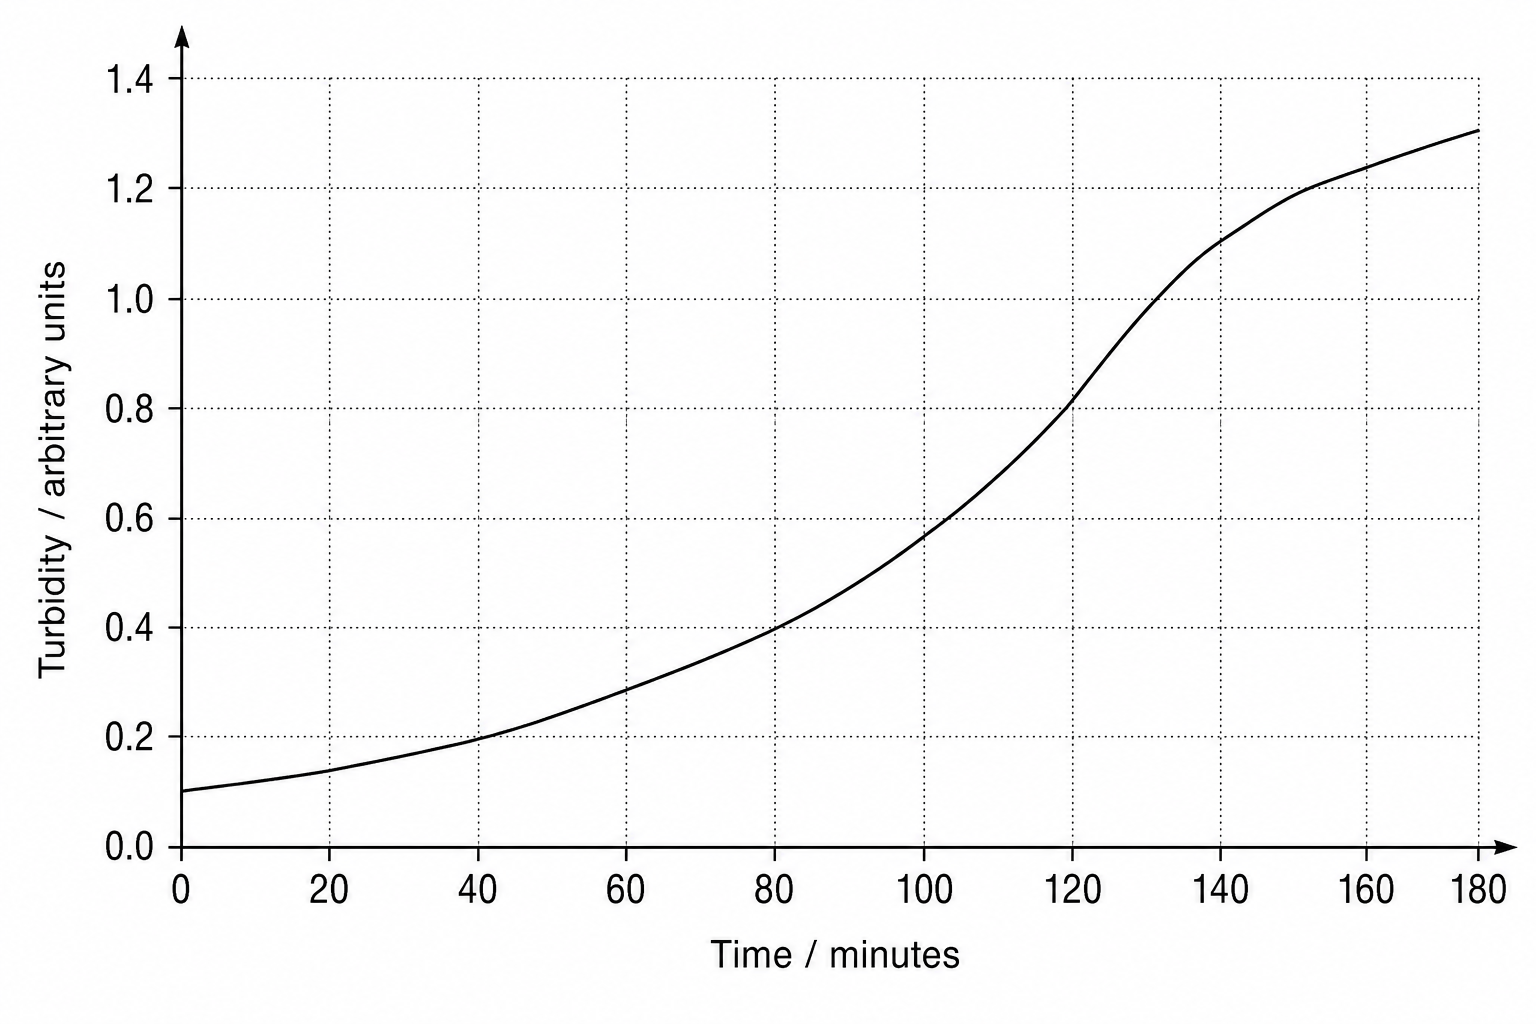
Line graph showing the optical density of a yeast culture over 180 minutes. The y-axis is labeled 'Turbidity / arbitrary units' and scales from 0.0 to 1.4 in increments of 0.2, with minor gridlines every 0.1. The x-axis is labeled 'Time / minutes' and scales from 0 to 180 in increments of 20. The curve passes through the coordinates: (0, 0.1), (40, 0.2), (80, 0.4), (120, 0.8), and (160, 1.2).

Calculate the time taken for the turbidity of the yeast culture to double from 0.4 to 0.8 arbitrary units.


[2]

Antibiotics, culturing microorganisms and monoclonal antibodies Questions

  1. GCSE
  2. /Biology
  3. /Antibiotics, culturing microorganisms and monoclonal antibodies