During an investigation into the growth rate of Escherichia coli in a liquid nutrient broth at 37∘C37^{\circ}\text{C}37∘C, a student monitored the optical density (OD600\text{OD}_{600}OD600) over a 9-hour period.
The scatter graph shows the plotted results alongside four proposed lines of best fit: Line W, Line X, Line Y, and Line Z.
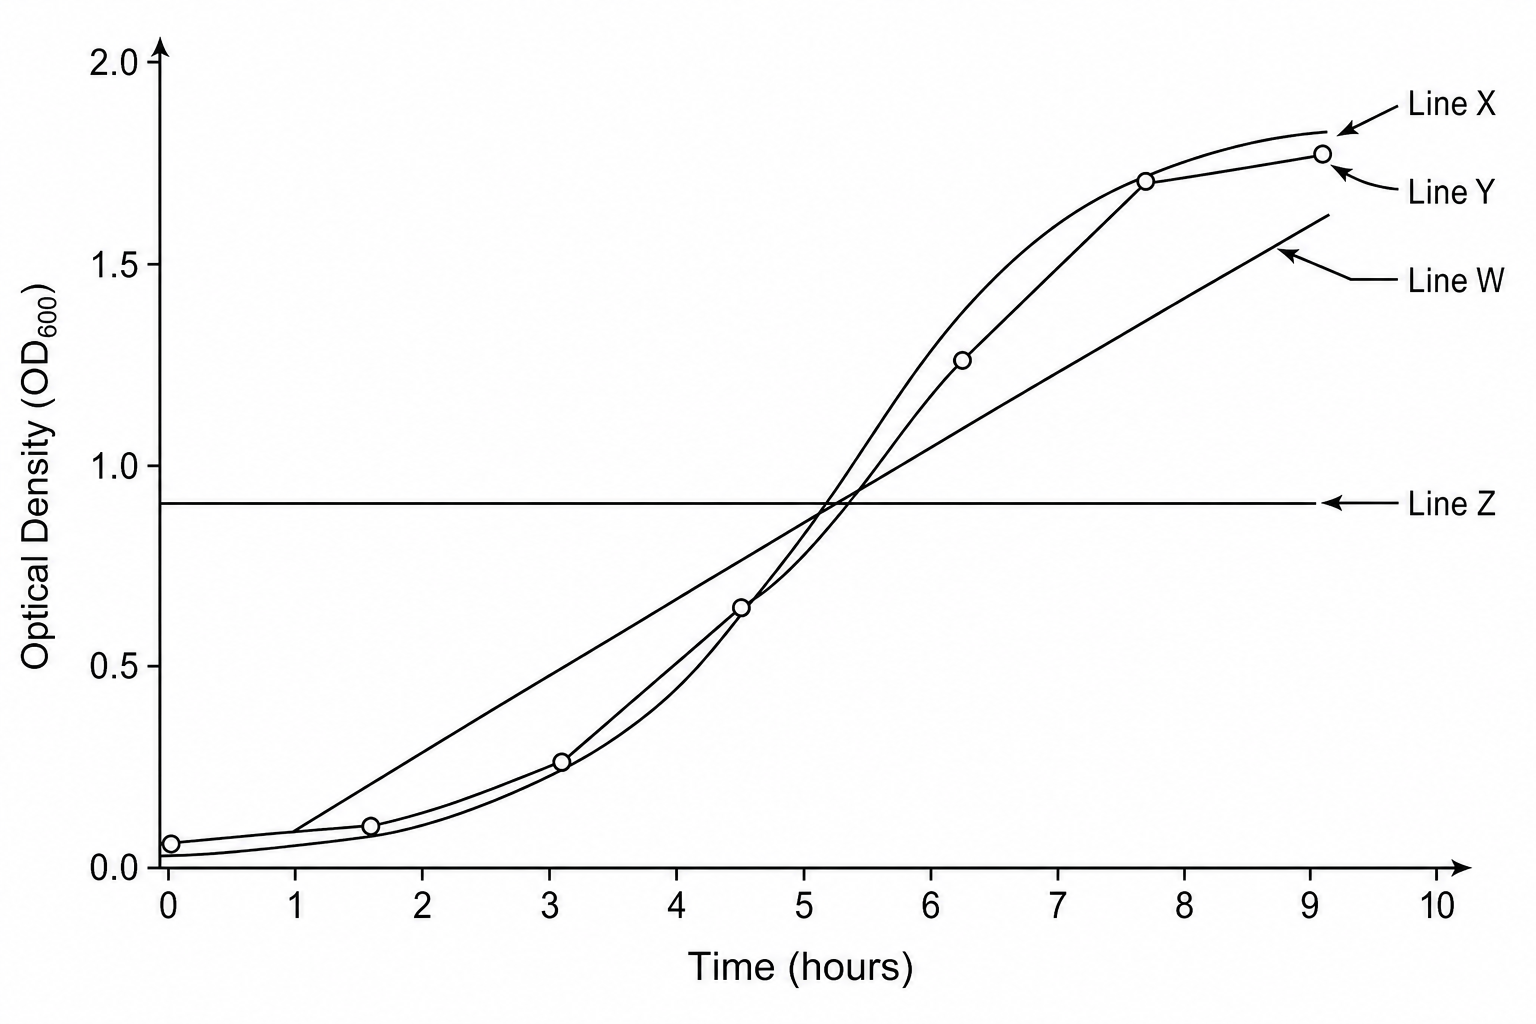
Which line represents the most appropriate line of best fit for this data?
Line W
Line X
Line Y
Line Z

