A student sets up a potential divider circuit to investigate how the output potential difference, VoutV_{\text{out}}Vout, varies with the incident light intensity, LLL. The circuit diagram, along with four proposed graphs (A, B, C, and D) showing the variation of VoutV_{\text{out}}Vout with LLL, is shown below.
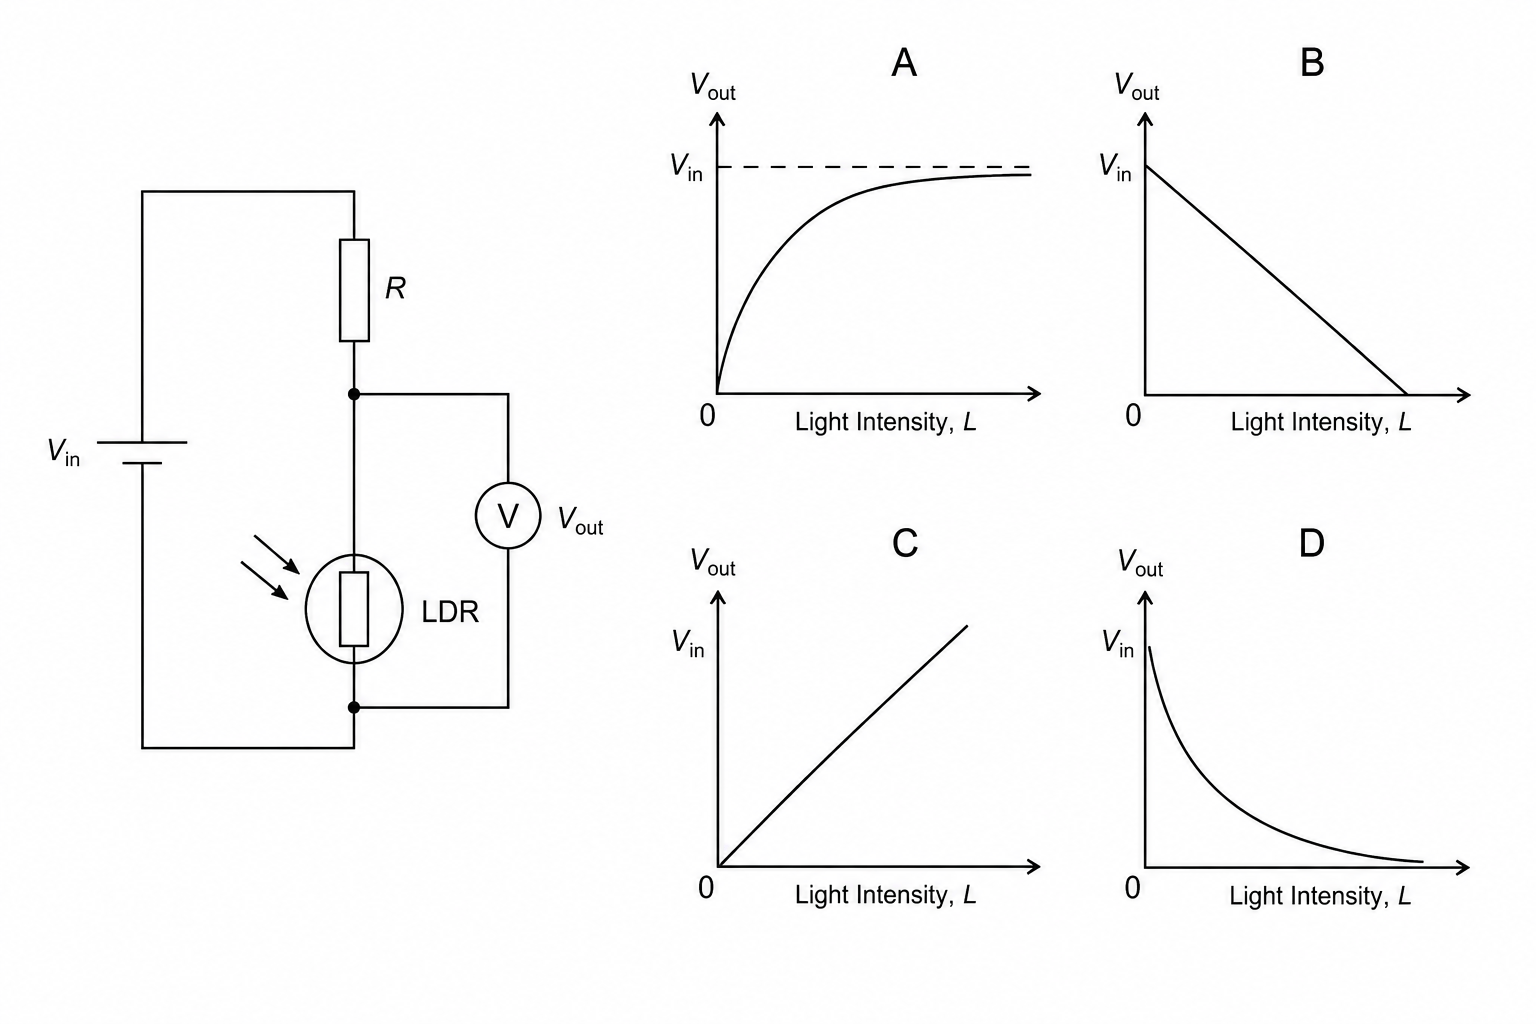
Which graph correctly represents the relationship between the output potential difference VoutV_{\text{out}}Vout and the light intensity LLL?
Graph A
Graph B
Graph C
Graph D