Question 5
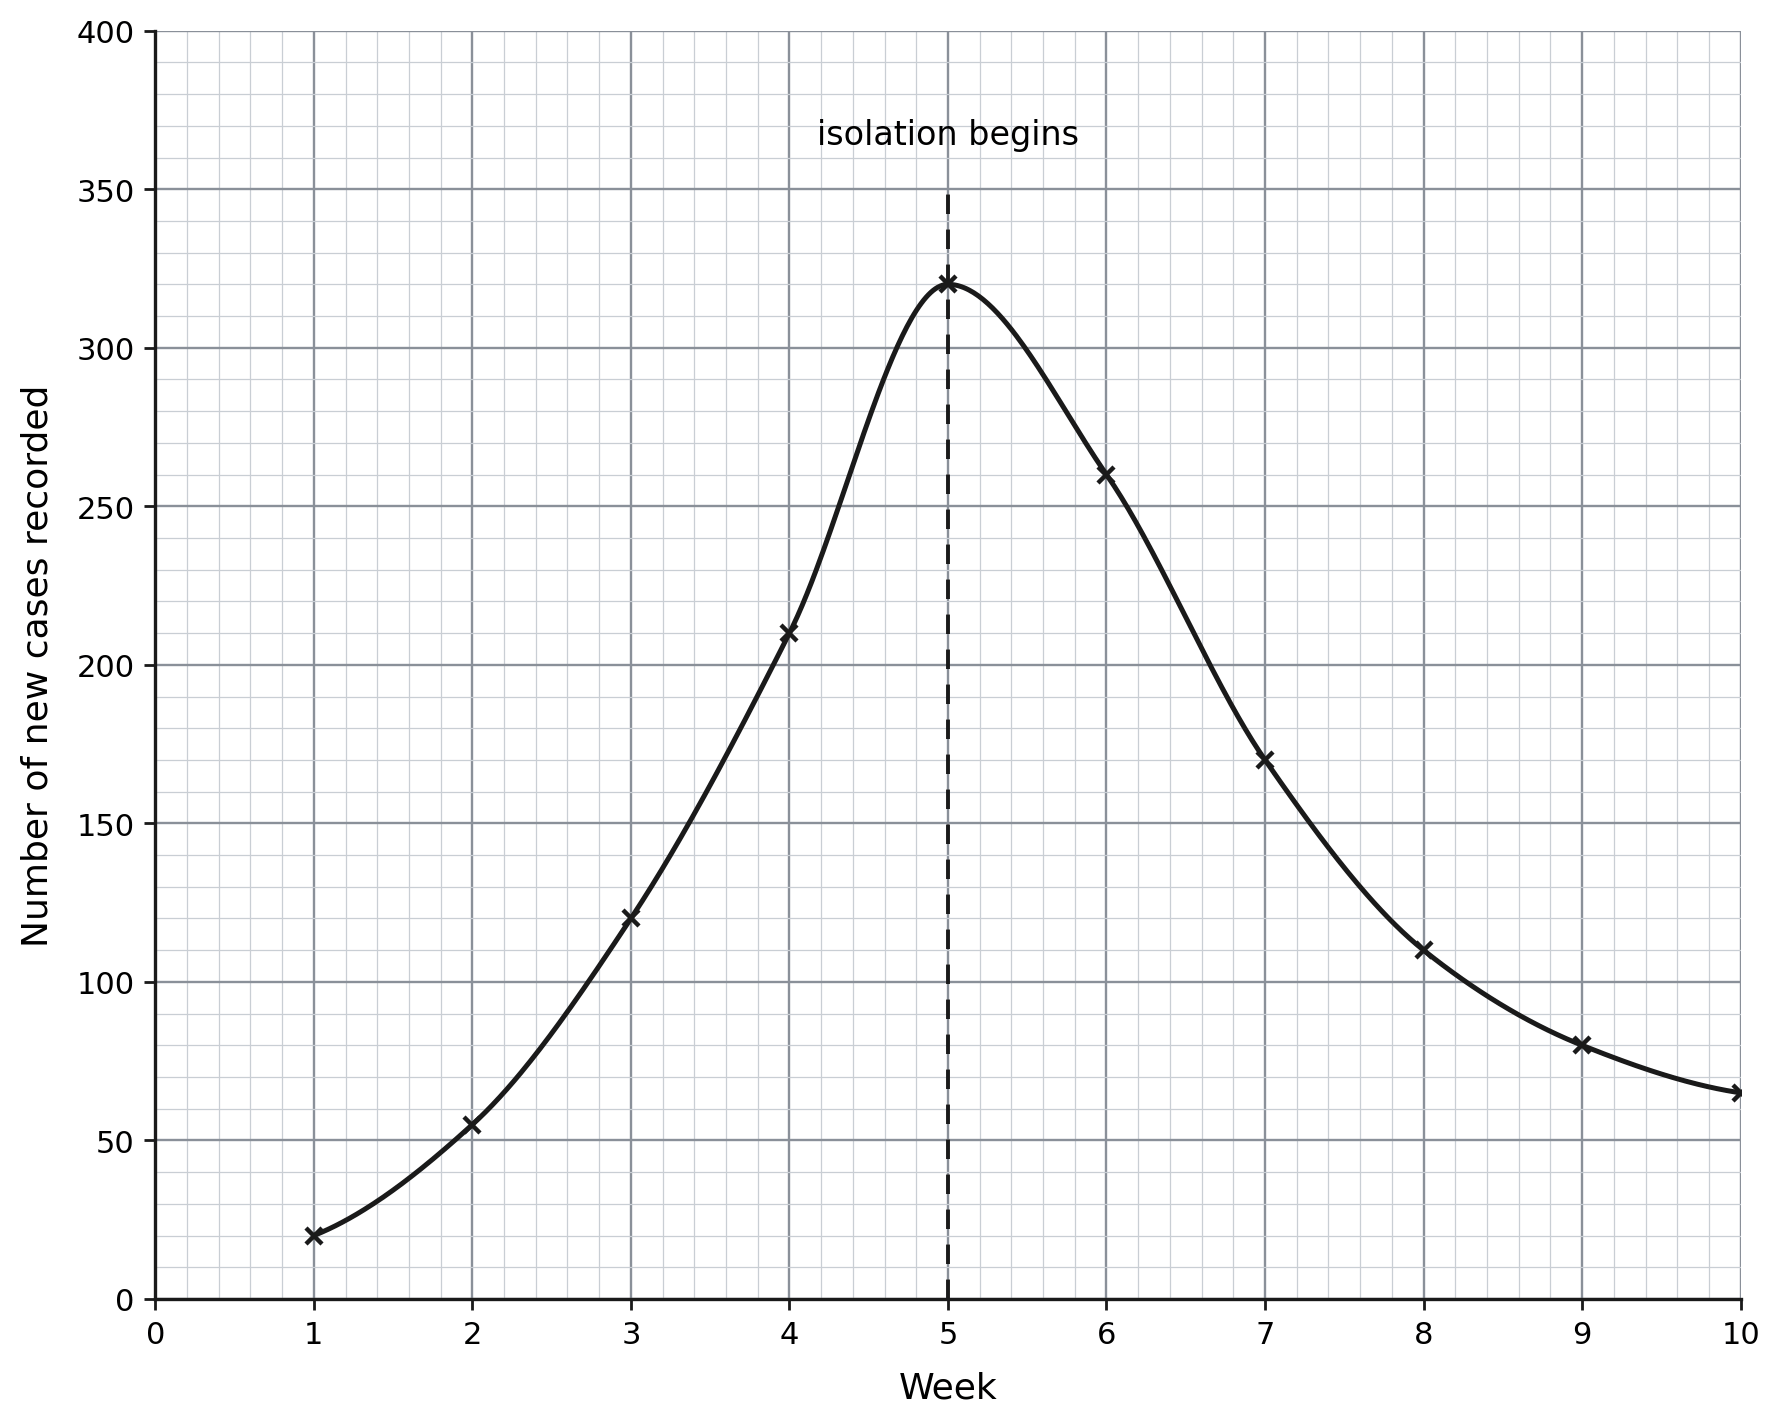
FThe figure shows the number of new cases of a communicable disease recorded each week in a city. The disease is caused by a virus that is spread through the air. From the start of week 5, everyone with the disease was isolated at home.
Figure: The number of new cases of a communicable disease recorded each week in a city, with the week that isolation began marked
a.[2]
Describe what the figure shows about the number of new cases from week 1 to week 5. Use data from the figure.
b.[2]
Calculate the percentage decrease in the number of new cases per week between week 5 and week 9.
c.[2]
Explain how isolating infected people reduced the number of new cases each week.
d.[1]
Isolation did not reduce the number of new cases to zero. Suggest one reason why.
3.1 Communicable diseases Questions
176 exam-style questions on AQA GCSE Biology 3.1 Communicable diseases, covering 3.1.1 Communicable (infectious) diseases, 3.1.2 Viral diseases, 3.1.3 Bacterial diseases, 3.1.4 Fungal diseases, 3.1.5 Protist diseases, 3.1.6 Human defence systems, 3.1.7 Vaccination, 3.1.8 Antibiotics and painkillers, and 3.1.9 Discovery and development of drugs. Each one has a worked solution and a mark scheme showing where the marks go.