Question 44
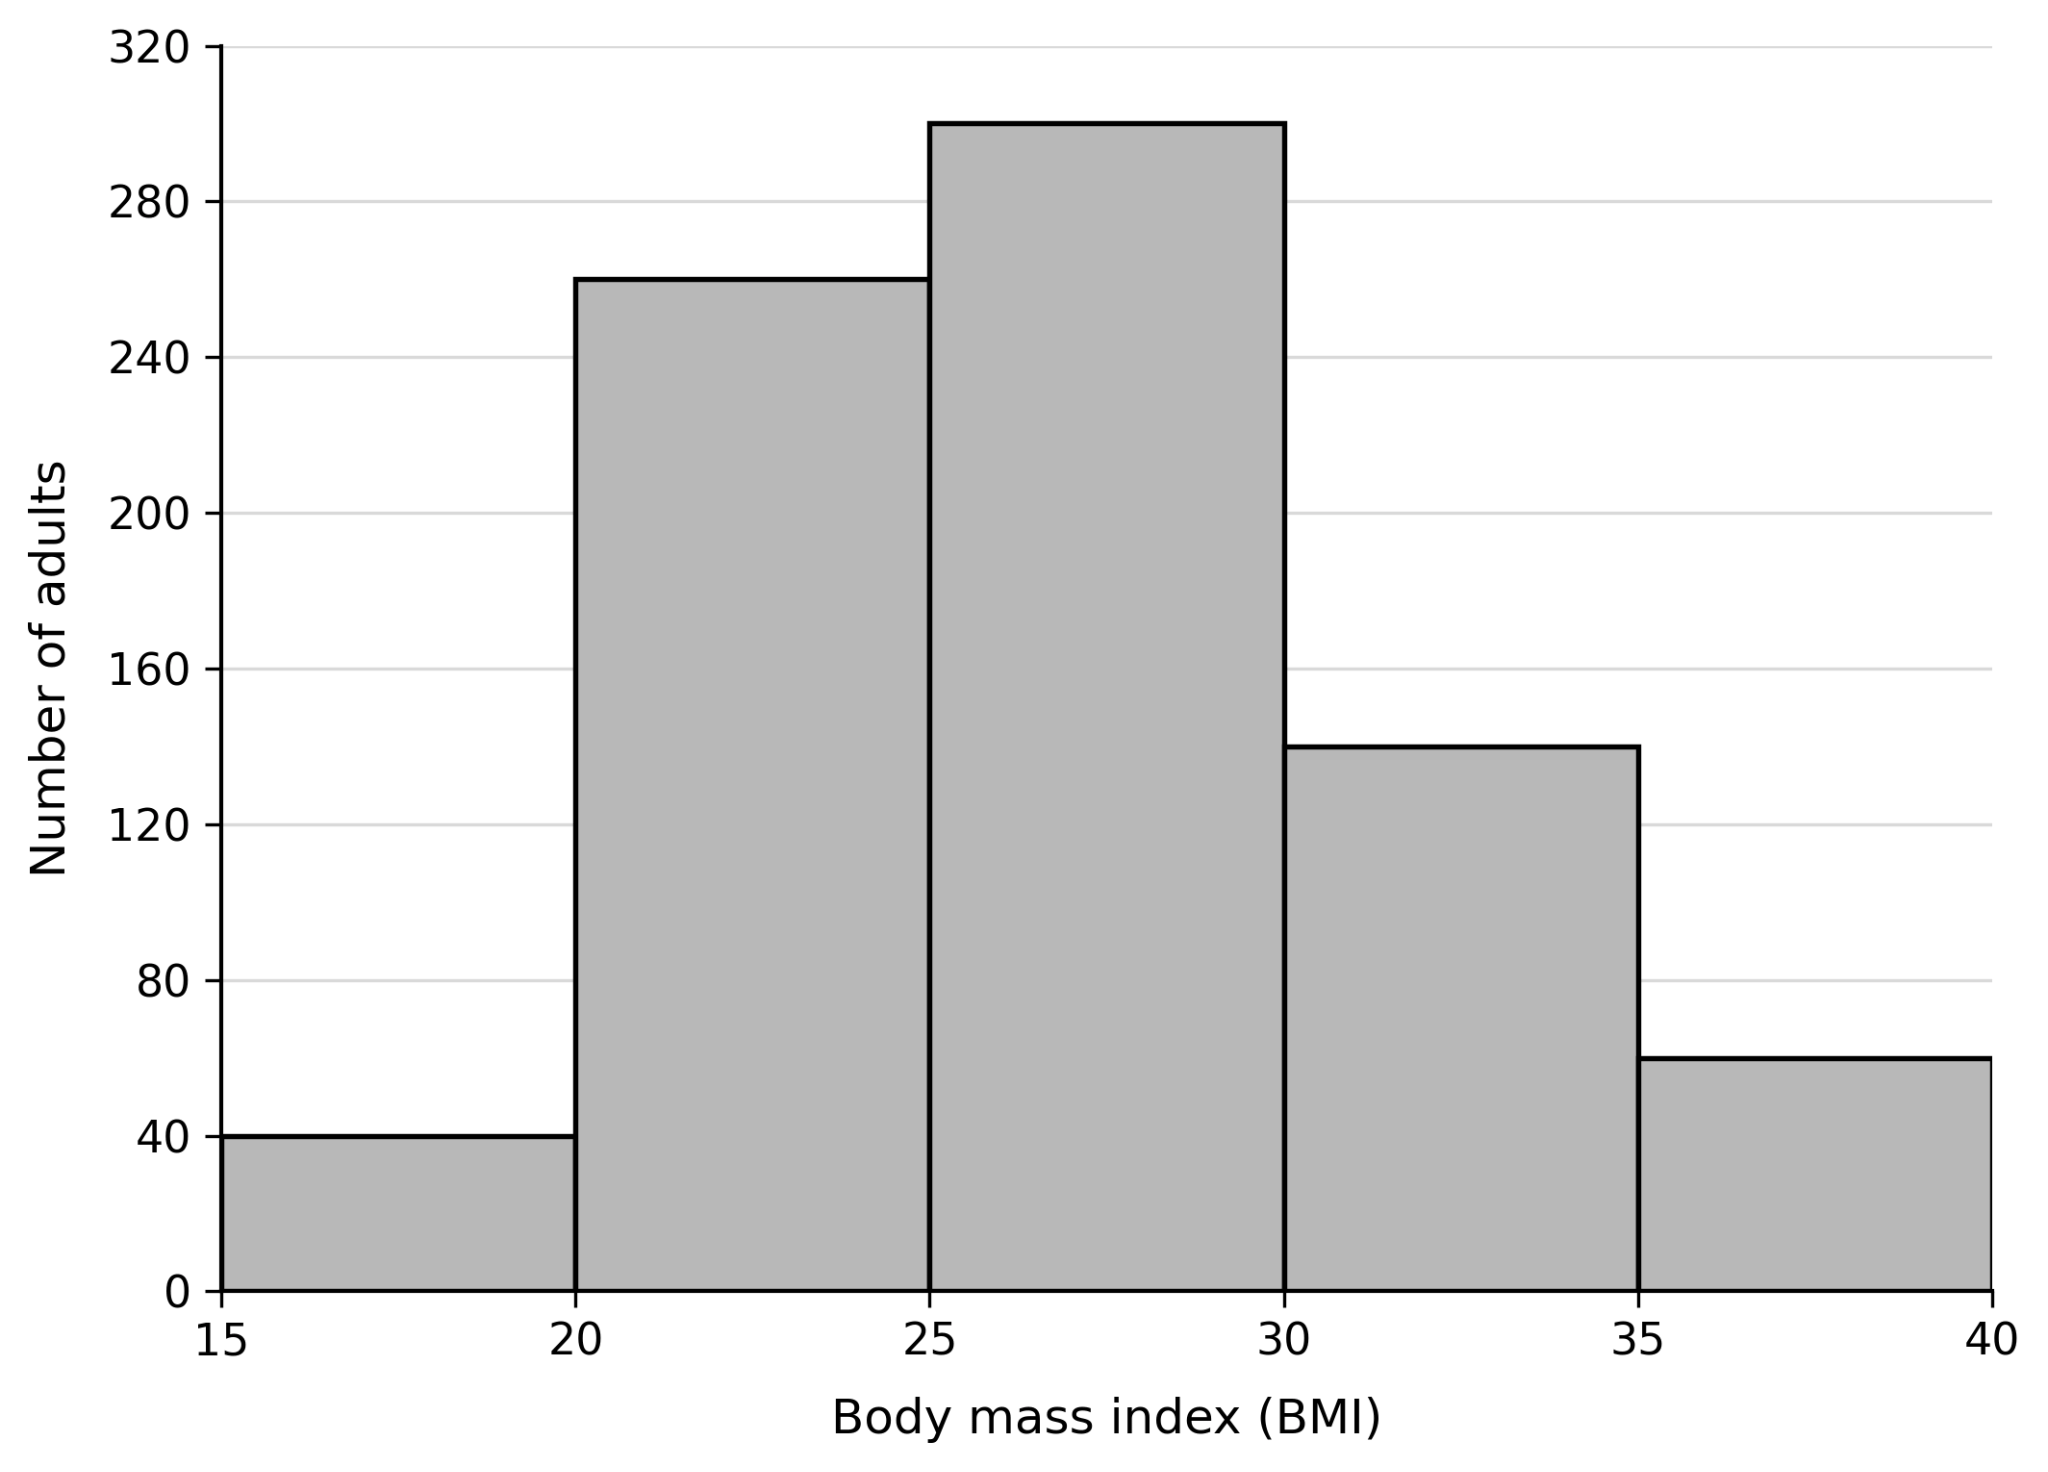
FScientists studied 800 adults chosen at random from one city. They measured the body mass index (BMI) of each adult. A BMI of 30 or more is classed as obese. The figure shows their results.
Figure: Histogram of the number of adults in each range of body mass index in a sample of 800 adults
a.[3]
Use the figure to calculate the percentage of the adults in the sample who are classed as obese.
b.[2]
The scientists concluded that a high BMI causes type 2 diabetes.
Explain why the data in the figure do not support this conclusion.
c.[1]
Suggest one advantage of choosing the 800 adults at random.
2.2 Animal tissues, organs and organ systems Questions
179 exam-style questions on AQA GCSE Biology 2.2 Animal tissues, organs and organ systems, covering 2.2.1 The human digestive system, 2.2.2 The heart and blood vessels, 2.2.3 Blood, 2.2.4 Coronary heart disease: a non-communicable disease, 2.2.5 Health issues, 2.2.6 The effect of lifestyle on some non-communicable diseases, and 2.2.7 Cancer. Each one has a worked solution and a mark scheme showing where the marks go.