Question 23
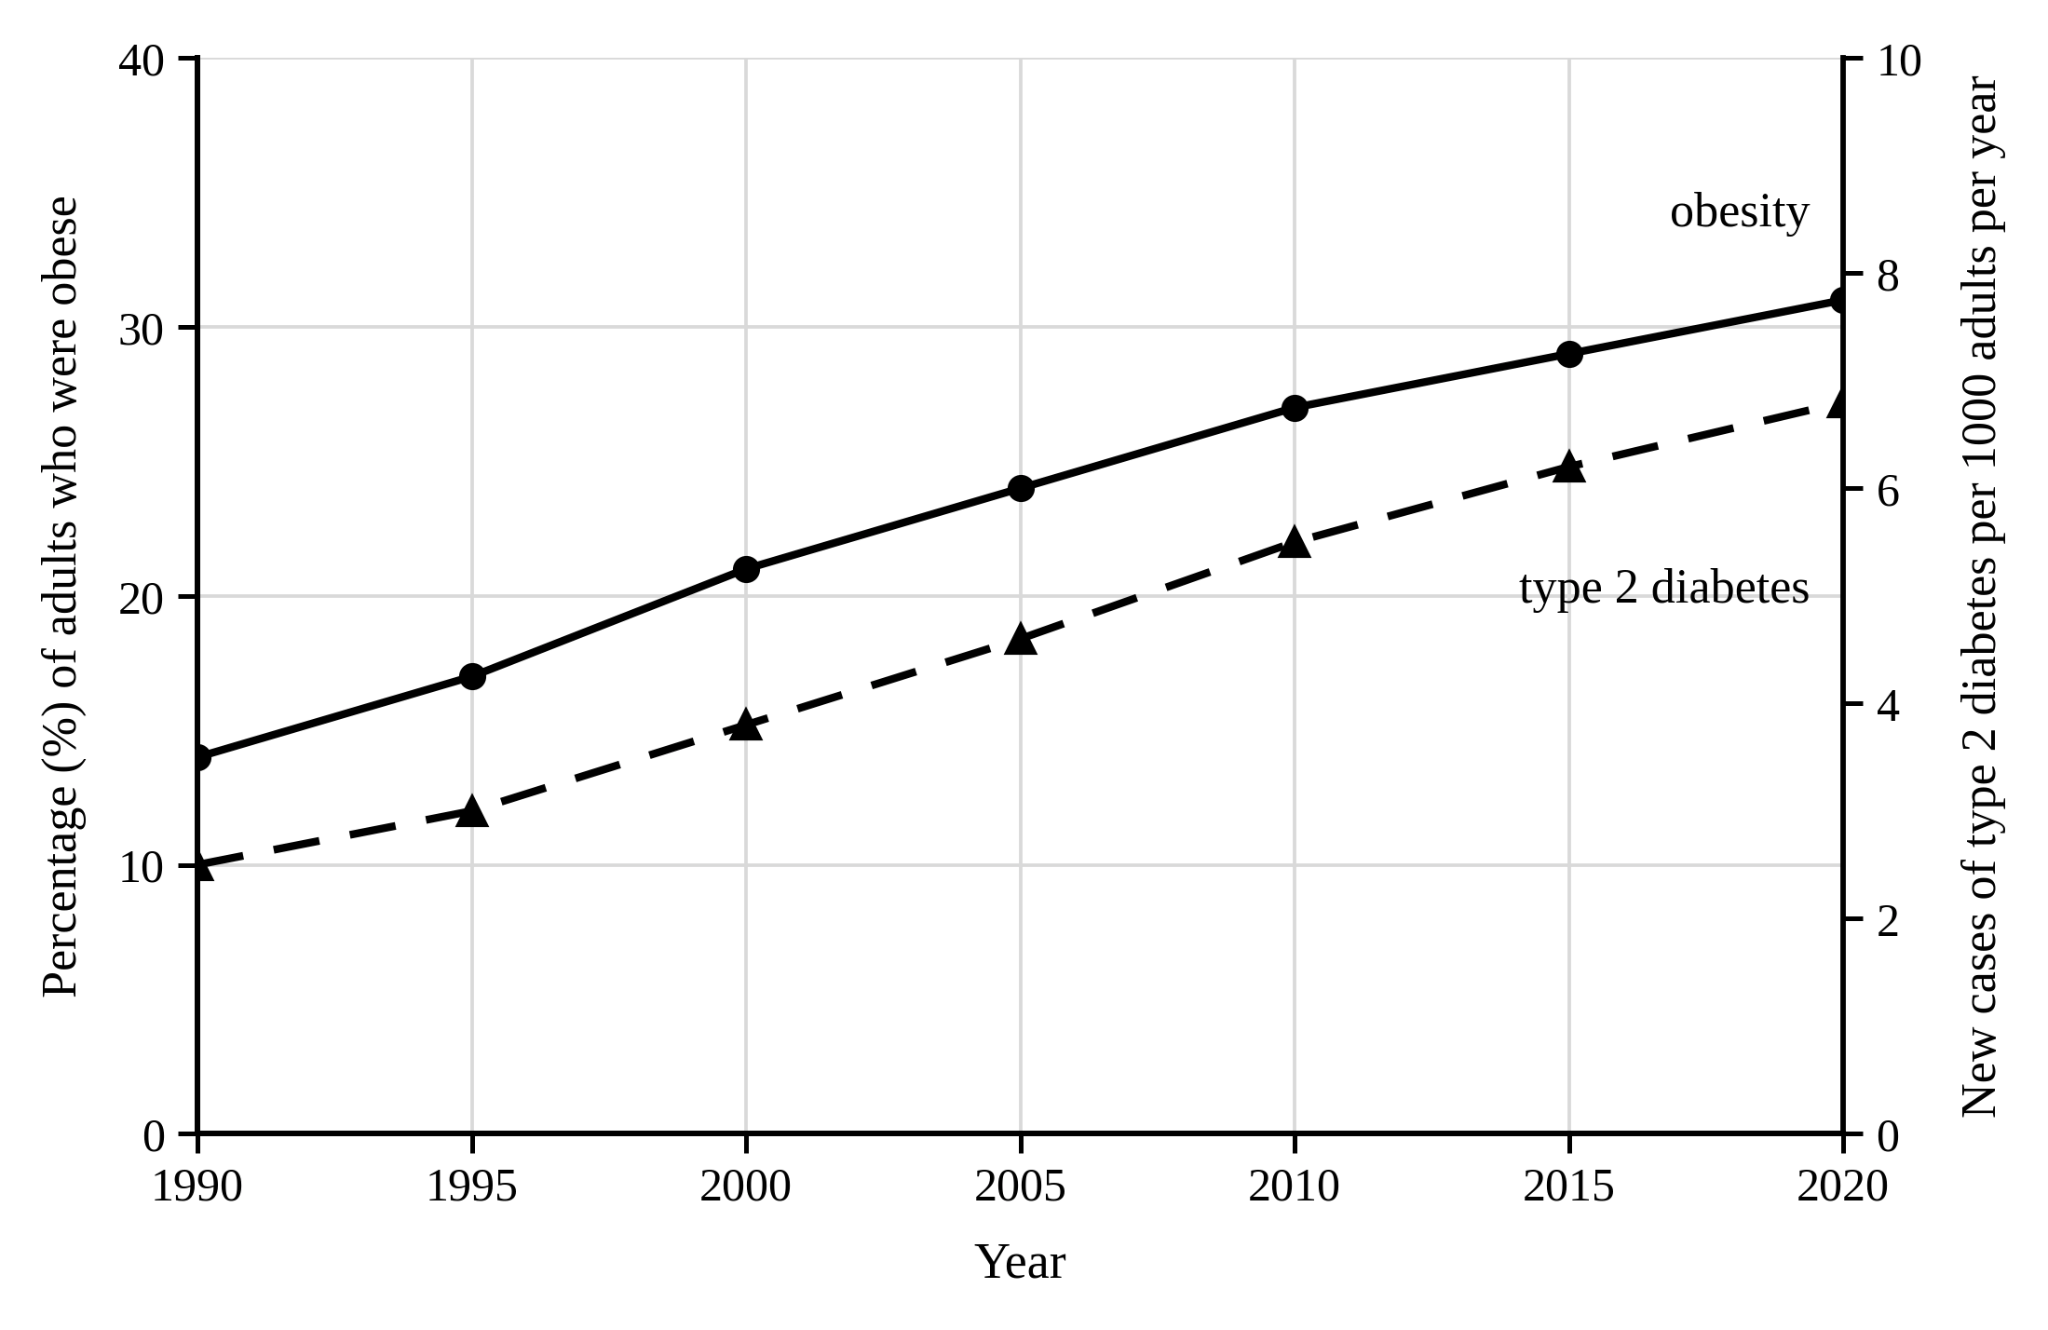
FThe graph shows data collected in one country between 1990 and 2020.
Figure: The percentage of adults who were obese and the number of new cases of type 2 diabetes each year, per 1000 adults, in one country between 1990 and 2020
a.[2]
Describe what the graph shows about obesity and type 2 diabetes in this country.
b.[3]
A newspaper used the graph in an article with the headline 'Obesity causes type 2 diabetes'. Evaluate whether the headline is justified.
c.[1]
Give one reason why these data cannot be used to predict whether one particular adult will develop type 2 diabetes.
2.2 Animal tissues, organs and organ systems Questions
179 exam-style questions on AQA GCSE Biology 2.2 Animal tissues, organs and organ systems, covering 2.2.1 The human digestive system, 2.2.2 The heart and blood vessels, 2.2.3 Blood, 2.2.4 Coronary heart disease: a non-communicable disease, 2.2.5 Health issues, 2.2.6 The effect of lifestyle on some non-communicable diseases, and 2.2.7 Cancer. Each one has a worked solution and a mark scheme showing where the marks go.