GCSE Statistics Command Words Explained
GCSE statistics command words explained clearly: learn what calculate, compare, interpret and justify require, then practise stronger answers under pressure.
A statistics question can contain familiar data, a familiar graph and a calculation you know how to do, yet still feel oddly difficult. Often, the obstacle is not the statistics. It is the instruction.
GCSE statistics command words tell you what kind of answer the examiner wants. Calculate asks for a numerical result. Compare needs linked statements about two distributions. Interpret asks what the data means in context. Justify requires evidence for a decision. Reading that verb accurately can be the difference between displaying everything you know and giving the precise evidence that earns the marks.
The definitions vary slightly in wording between exam boards, so check the guidance for your specification. However, the central habits below apply across GCSE Maths and GCSE Statistics papers from Edexcel, AQA, OCR and Eduqas.
Your command-word checklist
Before answering a statistics question:
- circle or underline the command word;
- identify the data, graph or calculation you must use;
- check whether the answer needs a value, statement, reason or judgement;
- look at the available marks for a rough indication of depth;
- use statistical evidence rather than vague impressions;
- write conclusions in the context of the question;
- reread the instruction before moving on.
The marks are a clue, not a rigid sentence counter. One precise comparison can be worth more than a paragraph that never compares anything.
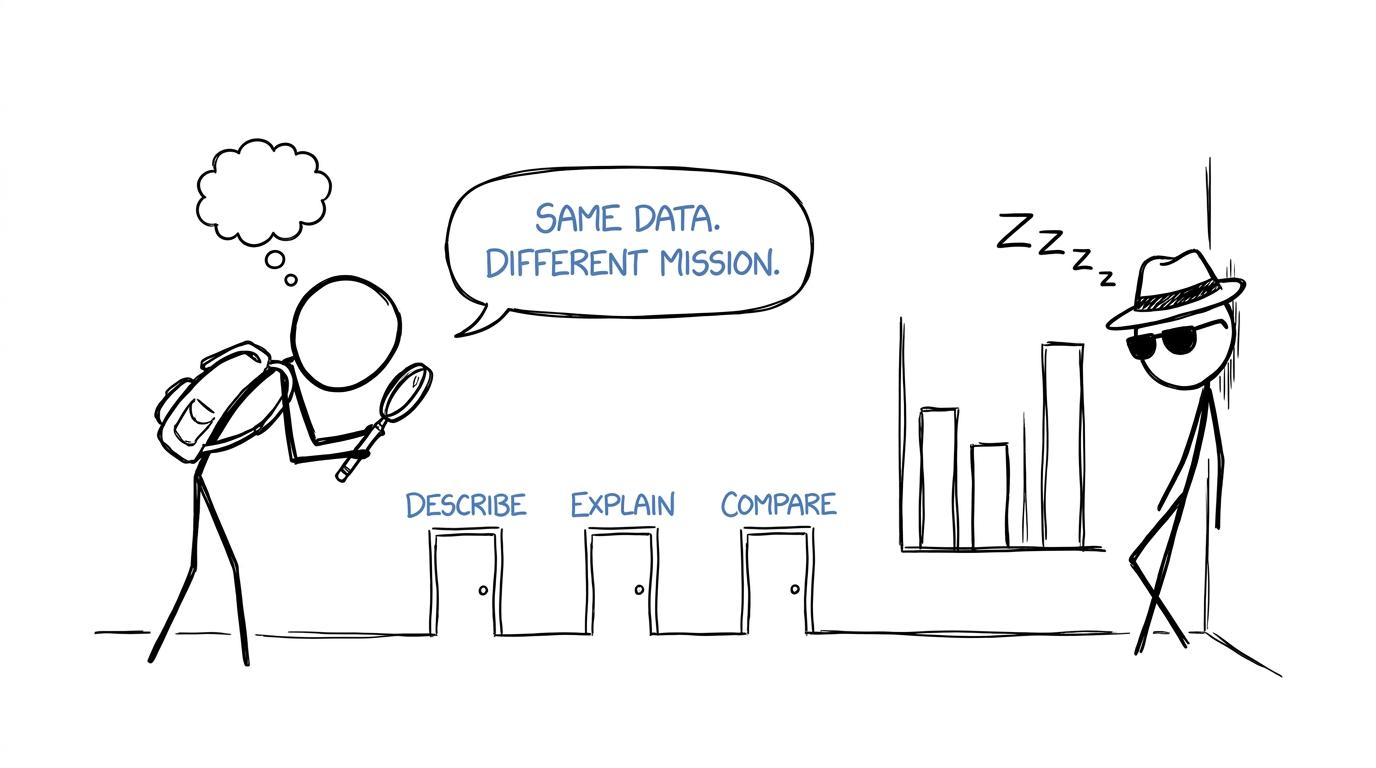 A student choosing between describe, explain and compare in an exam
What the main GCSE statistics command words mean
| Command word | What it is really asking for | Strong answer habit |
|---|---|---|
| State, give or write down | Supply a short fact, value or conclusion. | Answer directly without adding an unnecessary essay. |
| Identify | Select the required feature from the information. | Name it precisely and use the correct statistical term. |
| Calculate, find or work out | Perform the necessary mathematical steps. | Set out clear working, give the result and include units where relevant. |
| Estimate | Obtain an approximate value using the information or approximations available. | Show the assumptions, midpoints, graph reading or rounded values used. |
| Complete | Add the missing information to a table, graph or diagram. | Check labels, scale, totals and every required entry. |
| Plot | Mark data at the correct coordinates. | Use a sharp pencil and read both scales carefully. |
| Draw | Produce an accurate graph or statistical diagram. | Include suitable scales, labels and all required features. |
| Sketch | Show the important features approximately. | Prioritise overall shape and key features over exact plotting. |
| Describe | Say what the data or representation shows. | Use correct terminology and relevant features from the data. |
| Compare | Connect the similarities or differences between two sets of data. | Compare both centre and spread when the information allows it. |
| Interpret or comment | Explain what a result means in the question's context. | Translate the statistic back into a clear contextual statement. |
| Explain or give a reason | Make the reasoning behind a result or conclusion clear. | Link evidence to the conclusion using words such as “because” or “therefore”. |
| Justify | Support an answer, choice or judgement with mathematical evidence. | Give the evidence and state why it supports the decision. |
| Evaluate or discuss | Consider the available evidence, limitations or competing conclusions. | Reach a balanced judgement rather than listing disconnected facts. |
| Does the data support the statement? | Use calculations or statistical measures to decide whether a claim is supported. | Give a decision, evidence and a contextual conclusion. |
Calculate, work out and find
These words ask for a mathematical result. In statistics, that might involve an average, range, frequency density, probability or estimate.
For example, the mean and interquartile range are calculated using:
mean=total of the valuesnumber of values\text{mean}=\frac{\text{total of the values}}{\text{number of values}}mean=number of valuestotal of the values IQR=Q3−Q1\text{IQR}=Q_3-Q_1IQR=Q3−Q1Your final answer may be short, but your method should remain visible, particularly in a multi-step question. Clear working can communicate a correct approach even if an arithmetic slip affects the final value. Keep units with the answer and follow any requested degree of accuracy.
If averages are a weak spot, revisit the Averages revision guide before attempting mixed questions.
Estimate does not mean guess
Estimate has several statistical uses. It may ask you to read an approximate value from a graph, calculate an estimated mean from grouped data, or simplify a calculation using rounded values. The surrounding words reveal which meaning applies.
For an estimated mean from a grouped frequency table, class midpoints stand in for the unknown individual values:
estimated mean=∑fx∑f\text{estimated mean}=\frac{\sum fx}{\sum f}estimated mean=∑f∑fxHere, xxx represents a class midpoint and fff its frequency. The word estimated matters because the exact values within each class are not known.
When reading from a cumulative frequency graph, your answer is also an estimate. Construction lines should be clear enough to show where the reading came from. The Cumulative Frequency revision guide explains the graph-reading process and its connection with quartiles.
Describe, interpret and explain are different jobs
These words can look interchangeable under pressure, but they move through different levels of reasoning.
Describe
Describe what is visible or mathematically true. You might refer to the direction of a trend, an outlier, the shape of a distribution or a feature of a graph. Avoid empty phrases such as “it goes up and down” when a more precise statistical description is available.
Interpret or comment
Interpretation moves from the statistic to its real meaning. A median is not merely a line in a box plot; it represents a central value for the people, times, lengths or scores in the situation. Include the variable, group and unit when relevant.
Explain
An explanation supplies the link between evidence and conclusion. A useful structure is:
statistical evidence +++ what that evidence implies +++ context.
Do not assume the examiner will infer your reasoning from a number sitting on the page. Write the connection.
How to answer compare questions properly
A comparison must relate the two distributions directly. Two separate descriptions placed next to each other do not automatically form a comparison.
For box plots, comparison questions commonly invite you to consider:
- centre, often through the medians;
- spread, often through the ranges or interquartile ranges;
- context, explaining what the difference means for the groups.
Use relational language such as higher than, lower than, more consistent than or more spread out than. If the evidence is numerical, include the relevant values and units. The Box Plots revision guide is useful for revising the five-number summary before practising comparisons.
A smaller interquartile range indicates less variation in the middle half of the data:
IQR=Q3−Q1\text{IQR}=Q_3-Q_1IQR=Q3−Q1That supports language such as “more consistent”, provided the context makes that interpretation sensible. It does not prove that every individual result is close together.
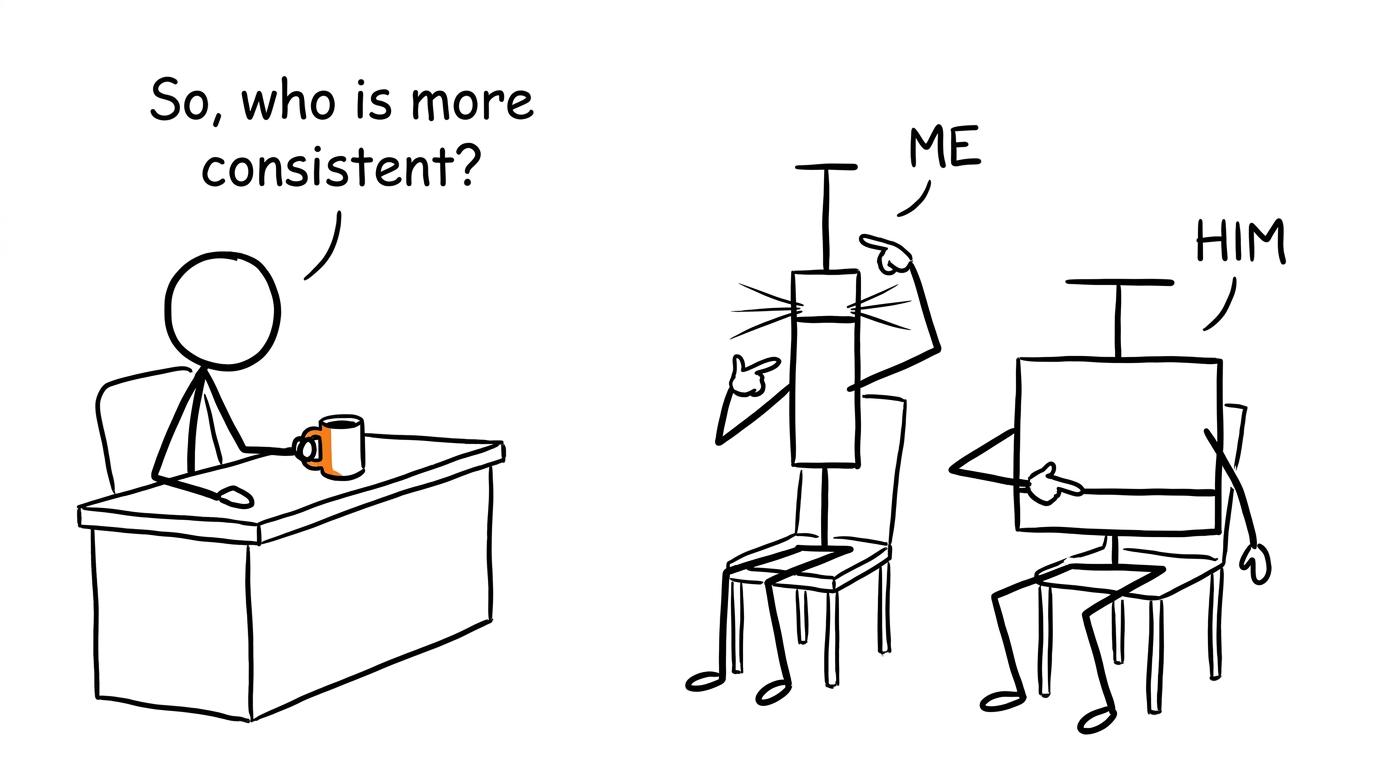 Two box plots attending an interview about consistency
Justify, evaluate and decide whether data supports a claim
These command words ask for judgement backed by evidence. A bare “yes” or “no” is rarely enough.
A dependable answer structure is:
- state the decision;
- give a relevant statistical calculation or observation;
- explain why that evidence supports the decision;
- acknowledge a limitation if the question asks you to evaluate or discuss.
Possible limitations include a small or unrepresentative sample, an unsuitable sampling method, missing information, an unfair graph scale or a conclusion that claims causation from association. Correlation can support a relationship between variables, but it does not by itself prove that one variable causes the other.
Be careful with absolute claims. Data may support a statement without proving it for an entire population. Statistical conclusions are often about the strength of available evidence, not certainty.
Draw, plot, complete and sketch
Presentation commands are practical, but they still test decisions.
For a graph or diagram, check:
- axes are labelled with variables and units;
- the scale is even and suitable;
- points or bars are placed accurately;
- a key is included if categories could be confused;
- the correct statistical representation has been used.
In a histogram, frequency is represented by bar area, with:
frequency density=frequencyclass width\text{frequency density}=\frac{\text{frequency}}{\text{class width}}frequency density=class widthfrequencyA tall bar is not automatically the most frequent class if class widths differ. Use the Histograms revision guide to secure the link between area, width and frequency density. For simpler categorical displays, the Bar Charts revision guide covers scales, labels and accurate reading.
Common mistakes with statistics command words
Calculating when the question asks you to interpret
A correct value may only be the evidence. Add a sentence explaining what it means for the people or objects in the question.
Describing two groups without comparing them
Use one connected statement that explicitly relates one group to the other. Include centre and spread when both are available.
Treating an estimate as an exact answer
Grouped data and graph readings usually cannot produce exact individual values. Preserve the language of estimation in your conclusion.
Giving an unsupported opinion
Words such as justify, evaluate and support require evidence. Personal preference is not statistical justification.
Ignoring units and context
A difference of 555 means little until the reader knows whether it represents seconds, centimetres or marks.
Assuming correlation proves causation
A pattern on a scatter graph can indicate association. It cannot, by itself, establish a cause-and-effect relationship.
Writing far more than the task requires
State and identify usually need concise answers. Save developed reasoning for commands such as explain, justify and evaluate.
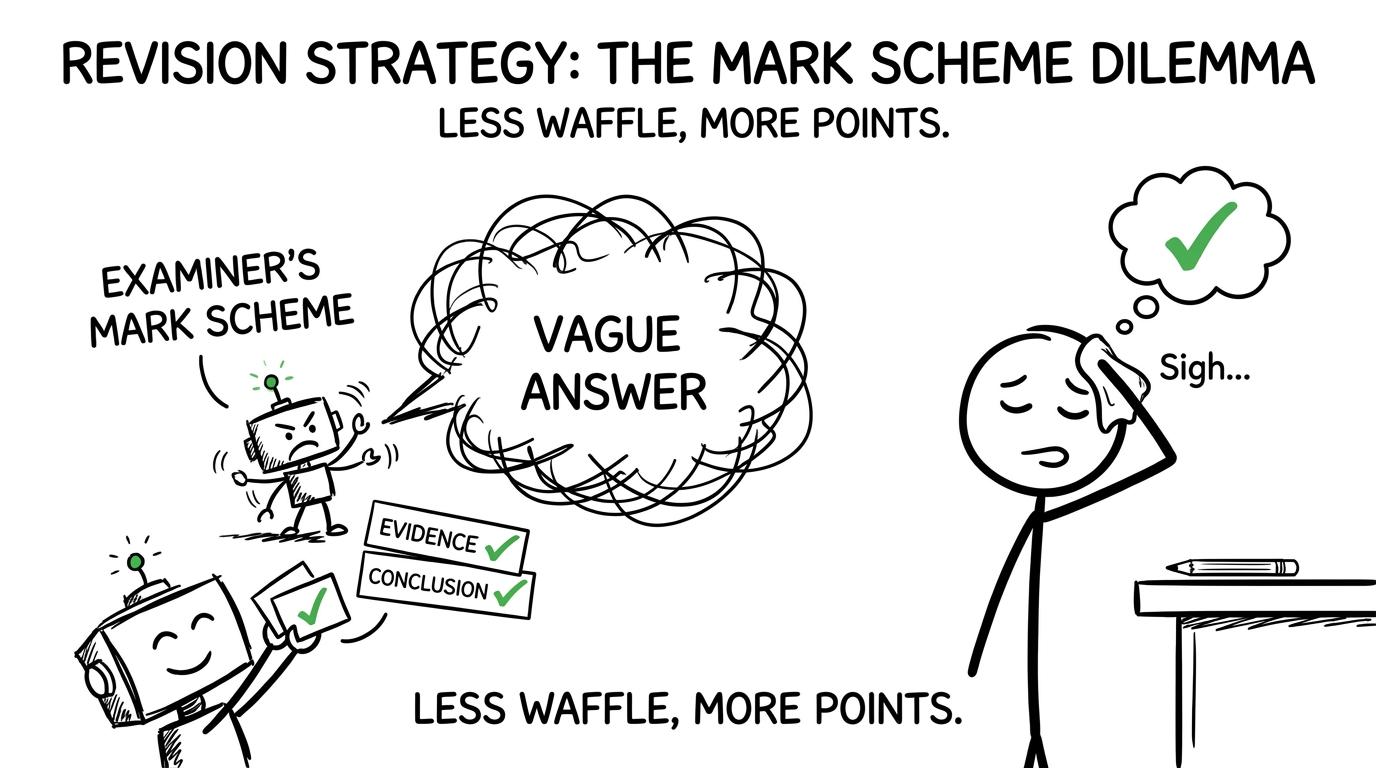 A mark-scheme robot choosing evidence and a conclusion over a vague answer
How to revise command words effectively
Command words become familiar through deliberate exam practice, not by memorising a glossary once.
Start at the GCSE Statistics revision hub and choose the resources for your exam board. The Edexcel GCSE Statistics revision area, for example, brings together lessons, worksheets, exam-style questions and papers.
Use this revision loop:
- answer a short set of questions without notes;
- underline each command word;
- mark your answers with the mark scheme;
- label each lost mark as knowledge, calculation, interpretation or misreading;
- rewrite the weakest answer so that it obeys the command word;
- return to the same skill in a mini test or past paper.
This changes marking from a judgement into feedback. If your calculations are correct but comparison marks keep disappearing, another page of arithmetic is unlikely to solve the problem. You need to practise comparative sentences.
The same approach works with full papers. Complete a paper under timed conditions, then use the mark scheme and video solutions to identify where your answer stopped short of the instruction. The GCSE Statistics resit revision plan also gives a structured approach to diagnosing and revisiting lost marks.
Turn instructions into marks
Statistics questions often test two skills at once: understanding the data and communicating what it shows. The command word is the bridge between them.
Pause before calculating. Decide whether the examiner wants a value, comparison, interpretation, reason or judgement. Then give exactly that, supported by the most relevant statistical evidence.
Make MathsGenie your next step. Use the free revision lessons to repair gaps, practise with topic questions and mini tests, then apply the language under pressure with past papers and predicted papers. Mark every attempt carefully using the mark schemes and video solutions. Over time, the command words stop feeling like traps and start behaving like directions.