Box Plots
Teach Genie
Review Box Plots by teaching Genie
Teach it back in your own words, spot gaps, and remember it better.

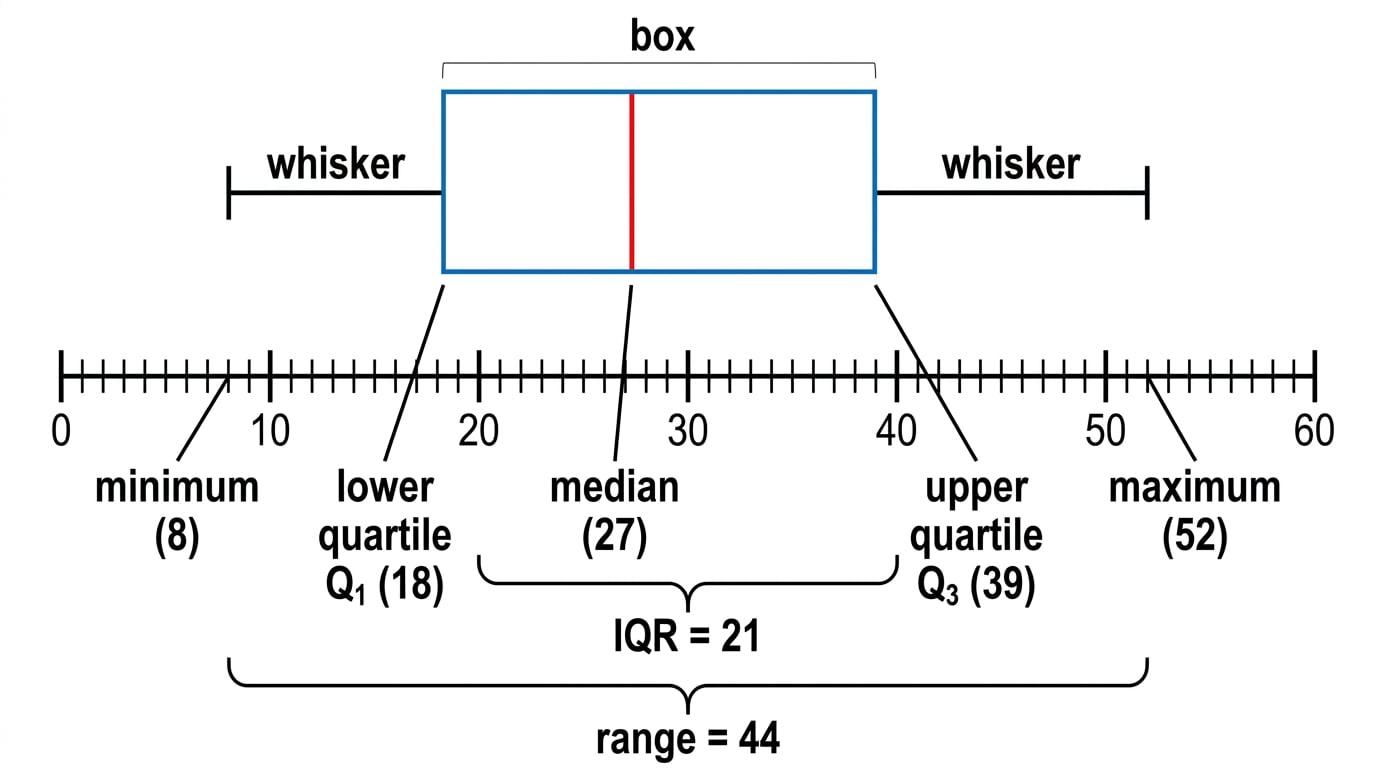
A distribution is the way a set of data values is spread out. A box plot is a quick way to show that spread on a number line. It uses the five-number summary: minimum, lower quartile Q1Q_1Q1, median, upper quartile Q3Q_3Q3, and maximum.
The whiskers run from the box to the minimum and maximum. The box goes from Q1Q_1Q1 to Q3Q_3Q3, and the line inside the box marks the median.
To measure spread, use range=maximum−minimum\text{range} = \text{maximum} - \text{minimum}range=maximum−minimum and IQR=Q3−Q1\text{IQR} = Q_3 - Q_1IQR=Q3−Q1. The IQR describes the middle 50% of the data, so it is often more useful than the range when comparing box plots.
Question 1
2 marksThe table shows some information about the heights, in cm, of some plants.
| Minimum | Lower Quartile | Median | Upper Quartile | Maximum |
|---|---|---|---|---|
| 11 | 28 | 37 | 42 | 51 |
Name the five values required for the "five-number summary" of a box plot.
Box Plots Revision Guide
Revision notes for Edexcel GCSE Maths Box Plots: explanations and worked examples.