

GCSE Economics Grade Boundaries Year to Year
GCSE economics grade boundaries year to year usually shift by a few marks. Explore recent AQA and OCR changes, why boundaries move and how to revise.
A mark can feel strangely powerful when it sits beside a grade boundary. Miss a grade by one mark in a mock and it is tempting to search for next summer's threshold, hoping it will move in your favour.
The short answer is reassuring: GCSE economics grade boundaries year to year usually change by only a few marks, although larger movements can occur. In the latest comparable AQA and OCR results from 202320232023 to 202520252025, most changes at the key grades shown below were between 222 and 555 marks out of 160160160. One OCR boundary moved by 666 marks.
These shifts do not make a grade deliberately easier or harder. Boundaries are adjusted after marking to account for differences in paper difficulty, with the aim of keeping the standard represented by each grade comparable over time.
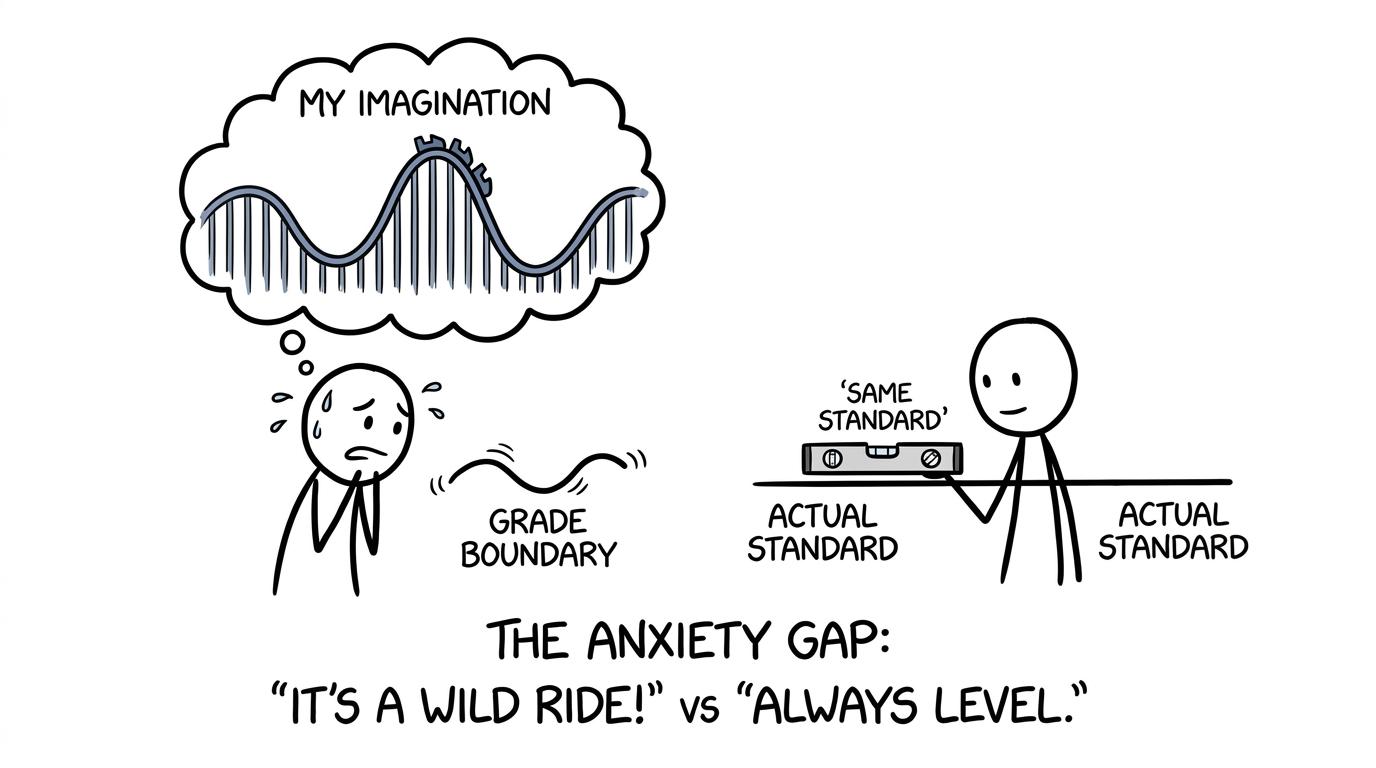 A student imagines a small grade-boundary movement as a rollercoaster
GCSE Economics grade boundary checklist
Before comparing figures, check that you have:
- the correct exam board: usually AQA or OCR for GCSE Economics in England
- the correct examination series
- the overall qualification boundary, not a notional paper boundary
- your combined raw mark across both papers
- remembered that Economics is untiered, unlike foundation and higher tier GCSE Maths
For AQA specification 813681368136 and OCR specification J205205205, candidates complete two papers worth 808080 marks each. The overall mark is therefore:
80+80=16080+80=16080+80=160A boundary is the minimum combined mark required for that grade. MathsGenie's GCSE Economics marks per grade guide explains how to read the overall thresholds without confusing them with individual paper figures.
How much have AQA boundaries changed recently?
The latest confirmed summer boundaries available at the time of writing are from 202520252025. The table compares selected overall AQA GCSE Economics boundaries across three normal summer examination series.
| Grade | 202320232023 boundary | 202420242024 boundary | 202520252025 boundary | Largest annual shift |
|---|---|---|---|---|
| 999 | 133133133 | 130130130 | 133133133 | 333 marks |
| 777 | 118118118 | 115115115 | 118118118 | 333 marks |
| 555 | 939393 | 898989 | 949494 | 555 marks |
| 444 | 818181 | 777777 | 828282 | 555 marks |
At grades 999 and 777, the boundary fell by 333 marks in 202420242024 and returned to its 202320232023 position in 202520252025. At grade 444, it fell by 444 marks and then rose by 555.
That is movement, but not chaos. Even the largest annual change in this selection, 555 marks, represents:
5160×100=3.125%\frac{5}{160}\times 100=3.125\%1605×100=3.125%You can inspect every grade in MathsGenie's AQA GCSE Economics grade boundary tables, or explore the longer pattern in the GCSE Economics grade boundary history.
How much have OCR boundaries changed?
OCR's recent figures show a similar principle, but not the same marks. That distinction matters because each board sets boundaries for its own papers.
| Grade | 202320232023 boundary | 202420242024 boundary | 202520252025 boundary | Largest annual shift |
|---|---|---|---|---|
| 999 | 124124124 | 118118118 | 121121121 | 666 marks |
| 777 | 101101101 | 979797 | 999999 | 444 marks |
| 555 | 747474 | 717171 | 747474 | 333 marks |
| 444 | 616161 | 585858 | 626262 | 444 marks |
The grade 999 threshold fell by 666 marks between 202320232023 and 202420242024, then increased by 333 marks in 202520252025. A 666-mark movement out of 160160160 is equivalent to 3.75%3.75\%3.75% of the available marks.
Notice something important: the 202520252025 grade 999 threshold was 133133133 for AQA but 121121121 for OCR. This does not prove that OCR was easier to pass or AQA was a harder course. Raw boundaries cannot be compared in isolation because the questions, mark schemes and performance of candidates differ.
Why GCSE Economics grade boundaries move
Exam boards cannot know with complete precision how demanding a paper will feel before thousands of candidates sit it. A question may be technically within the specification yet prove harder than expected. Another may give candidates a clearer route into the analysis than its writers anticipated.
Ofqual's published guidance explains that boundaries are set when marking is nearly complete. Statistical evidence is considered alongside expert judgement, including senior examiners' review of work around possible boundary marks.
The direction is straightforward:
- if a paper proves harder, boundaries may move down
- if a paper proves easier, boundaries may move up
- if the overall demand is similar, boundaries may remain close to the previous year
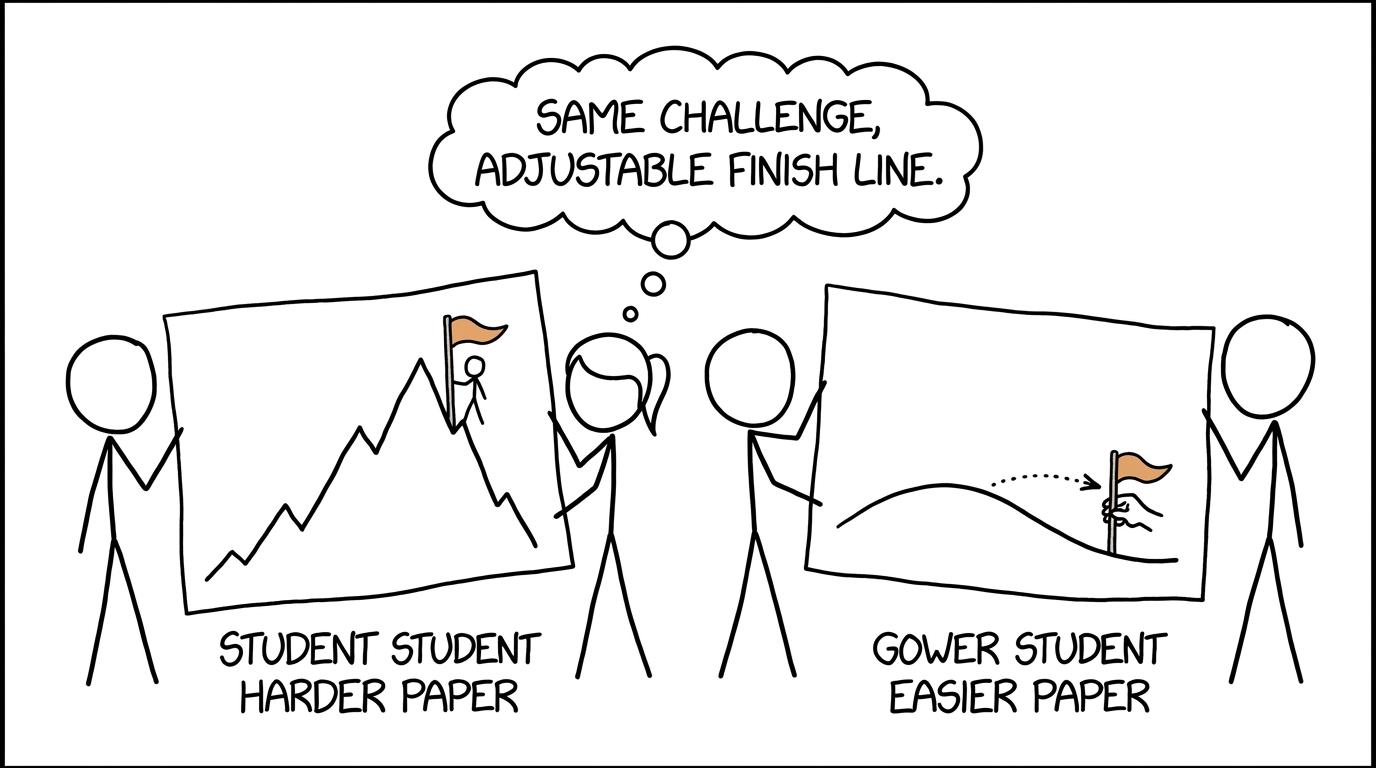 Two exam papers use a movable finish line to keep the standard fair
The movable finish line is not a loophole. It is part of the fairness mechanism. The objective is that the quality of work required for a grade remains comparable, even when the raw mark changes.
There are no fixed quotas saying that a particular number of candidates must fail or achieve grade 999. A higher boundary also does not mean examiners decided to be harsher. It normally indicates that the available evidence suggested candidates found the assessment more accessible.
Are future boundaries predictable?
Not reliably. Previous boundaries provide a sensible range for marking old papers, but the official threshold for a new series cannot be known before the papers have been taken and largely marked.
For revision, a better estimate is a range rather than one magic number. If an old boundary for your target grade was 949494, treating 949494 as a guaranteed future threshold leaves no protection against normal movement. A stronger aim is to perform consistently several marks above historical boundaries.
This is the same measured approach that helps in maths. Percentages, averages and variation describe evidence; they do not predict the next paper with certainty. Students wanting to strengthen those data skills can use MathsGenie's free GCSE Statistics revision resources, including past papers, exam questions and mark schemes.
What the changes mean for your revision
A boundary is useful as a measuring tool, not as a revision target to chase every evening. Your real task is to improve the quality and reliability of your answers.
Build a margin rather than aiming at the line
Suppose your target-grade boundary has recently occupied a narrow region. Your aim should still sit above that region. The extra marks protect you against an annual shift, a misread question or an answer that does not quite satisfy the mark scheme.
Match every paper to its own boundary
When completing a 202320232023 paper, use the 202320232023 boundary for your board. Do not mark it using 202520252025 figures simply because they are newer. The boundary belongs to the specific assessment whose difficulty it was designed to reflect.
Turn totals into topic decisions
A total mark tells you where you finished. It does not tell you what to do tomorrow.
After marking, classify lost marks: missing knowledge, weak application, limited evaluation, incomplete chains of reasoning, poor use of data or time pressure. Maths students can apply the same diagnostic habit through the GCSE Maths revision hub, where revision lessons and topic questions help turn a paper score into a focused plan.
MathsGenie's guide to when to start GCSE past papers also explains why papers work best in phases: short diagnostic tasks first, followed by timed sections and complete papers.
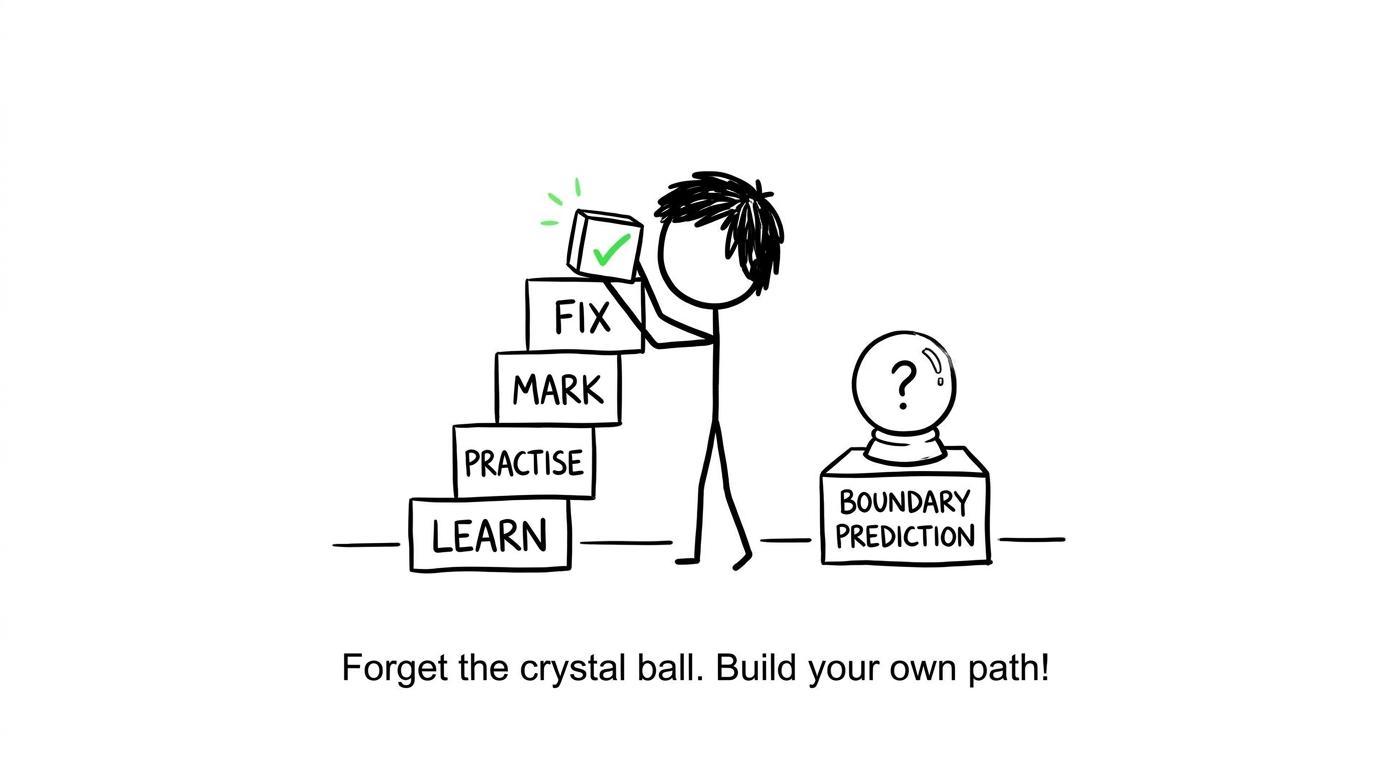 A student chooses a revision ladder instead of a grade-boundary crystal ball
Common mistakes when reading grade boundaries
Treating a paper boundary as the final grade
AQA and OCR award the qualification using the combined mark across both Economics papers. Published component boundaries may be notional and are mainly illustrative. They are not separate final grades.
Comparing boards as if their papers were identical
AQA and OCR both have totals of 160160160, but their raw thresholds should not be ranked without considering assessment difficulty. A lower boundary is not evidence of a softer qualification.
Assuming last year's boundary is guaranteed
Historical figures are useful for judging past-paper performance. They are not advance announcements for the next examination series.
Forgetting the examination series
Pandemic-era arrangements and November series should not be mixed casually with recent summer figures. For the clearest current comparison, use like-for-like summer series under normal grading arrangements.
Revising only enough to scrape a predicted threshold
Aiming for the exact boundary makes every dropped mark dangerous. Build a cushion by correcting recurring weaknesses and retesting them under timed conditions.
Focus on the standard, not the moving number
GCSE Economics boundaries do change, but recent AQA and OCR evidence suggests that key thresholds commonly move by a modest number of marks from one normal summer series to the next. Occasional larger shifts are possible because no two assessments perform identically.
The calm response is not to predict the boundary. It is to become less dependent on it.
Start with MathsGenie's one-week GCSE revision plan or explore the GCSE predicted topics revision strategy. Use revision lessons to repair knowledge, practice questions and mini tests to build accuracy, then past papers, predicted papers, mark schemes and video solutions to test whether the improvement survives under pressure.
A boundary can move by a few marks. Stronger preparation can move your performance by more.










