GCSE Computer Science: State vs Private Results
GCSE computer science state vs private results explained: what 2025 data shows, why school averages differ, and what students can control in revision.

A school average can feel strangely personal. If one type of school records stronger GCSE results, it is easy to hear a prediction about your own future rather than a description of thousands of past entries.
The latest evidence on gcse computer science state vs private results needs more care than that. Official data shows substantial differences between school types across GCSE subjects overall. Computer Science also has a distinctive national results profile. But the published headline figures do not prove that attending a private school causes a particular Computer Science grade or that school type determines what any individual student can achieve.
For students preparing for maths exams, this is more than an interesting comparison. It is a lesson in percentages, samples, correlation and the danger of drawing conclusions from grouped data.
The short answer
Here is what to keep in mind:
- Independent schools achieve a higher proportion of top GCSE grades than non-selective state schools when all subjects are combined.
- Selective state schools outperform both comprehensive and independent schools at some headline grade thresholds.
- Across England, GCSE Computing recorded 88,75088{,}75088,750 results in 2025. Of these, 29.6%29.6\%29.6% were at grade 7 or above and 69.2%69.2\%69.2% were at grade 4 or above.
- These national Computer Science figures combine students from different school and centre types.
- School-type comparisons describe groups, not the likely result of a particular student.
- Differences in intake, prior attainment, subject entry policies, selection and cohort size can all influence the averages.
The sensible conclusion is not that school type is irrelevant. It is that the available figures cannot isolate its effect from everything else happening around it.
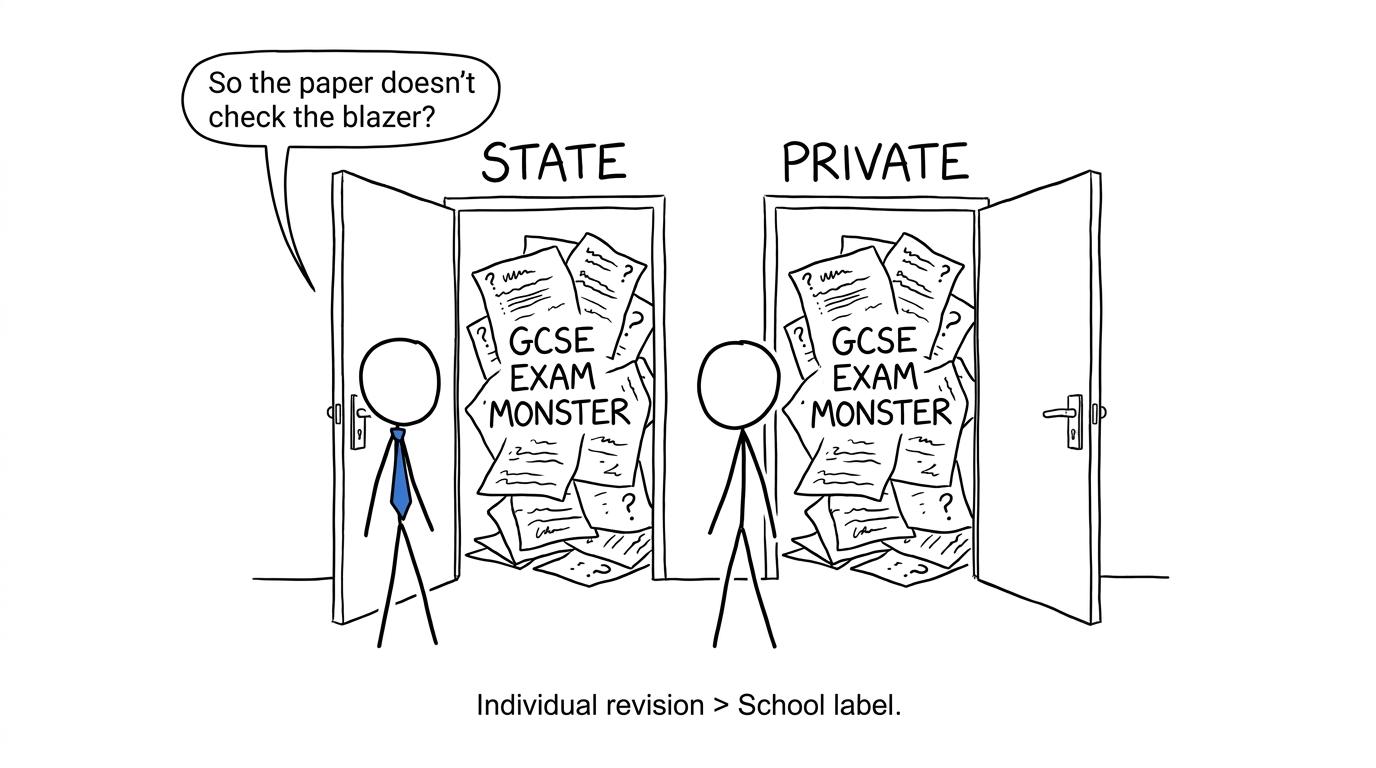 Two students discover that the GCSE paper does not check their school blazer
What the latest GCSE results show
The most recent complete results considered here are from summer 2025. The Joint Council for Qualifications reports that GCSE Computing in England had 88,75088{,}75088,750 results, down from 92,77892{,}77892,778 in 2024.
At the main thresholds:
- 29.6%29.6\%29.6% achieved grade 7 or above in 2025, compared with 28.3%28.3\%28.3% in 2024.
- 69.2%69.2\%69.2% achieved grade 4 or above in 2025, compared with 68.3%68.3\%68.3% in 2024.
These are cumulative percentages. A student achieving grade 8, for example, is included in the grade 7-and-above total.
The figures show what happened nationally. They do not, by themselves, divide Computer Science candidates into state and private school groups. That distinction matters because a national subject result cannot answer a school-type question on its own.
Ofqual also publishes an interactive GCSE outcomes dashboard with results by centre type and subject. Its categories include academies, free schools, secondary comprehensives, secondary modern schools, selective schools and independent schools. This is more informative than forcing every centre into only two boxes labelled “state” and “private”.
How large is the broader state-private GCSE gap?
For all GCSE subjects combined in England in 2025, Ofqual reported these headline outcomes:
- Independent schools: 48.1%48.1\%48.1% of results at grade 7 or above and 89.6%89.6\%89.6% at grade 4 or above.
- All state-funded centres: 20.7%20.7\%20.7% at grade 7 or above and 66.5%66.5\%66.5% at grade 4 or above.
- Secondary comprehensive or middle schools: 19.7%19.7\%19.7% at grade 7 or above and 68.5%68.5\%68.5% at grade 4 or above.
- Selective state schools: 63.2%63.2\%63.2% at grade 7 or above and 97.4%97.4\%97.4% at grade 4 or above.
That last comparison is important. “State versus private” hides a wide range of outcomes inside the state sector. Selective state schools had a higher proportion of top grades than independent schools in the all-subject data, while non-selective categories recorded lower proportions.
A simple percentage-point gap is calculated as:
Percentage-point gap=percentage for group A−percentage for group B\text{Percentage-point gap}=\text{percentage for group A}-\text{percentage for group B}Percentage-point gap=percentage for group A−percentage for group BThis describes the distance between two reported proportions. It does not explain why that distance exists.
Students can strengthen the skills needed to interpret such claims through GCSE Statistics revision, which covers averages, sampling, distributions and the interpretation of data.
Why headline figures need context
A result can be accurate and still be easy to misunderstand. Several factors sit behind a school-type average.
Schools do not begin with identical cohorts
Independent schools may use academic admissions, entrance assessments or fee-based access. Selective state schools also admit pupils partly through academic selection. Comprehensive schools generally serve a broader local intake.
Prior attainment is therefore unlikely to be distributed evenly between categories. Comparing final grades without controlling for starting points cannot tell us how much progress each school caused.
Not every school enters the same pupils
GCSE Computer Science is optional in many schools. One centre may allow a broad range of pupils to choose it; another may guide the subject towards pupils with strong prior attainment in maths or related areas.
This is selection into the subject itself. A higher average could partly reflect who was entered rather than only how effectively the course was taught.
Entry numbers also matter. A school with a small Computer Science cohort can see its percentage change sharply when only a few results move between grade bands.
Centre type is not a complete description of education
Ofqual’s categories are based on centre classifications. A label such as “academy” or “independent” does not tell you about teacher experience, curriculum time, class size, staff turnover, computing facilities or the support available at home.
Two schools in the same category can be very different. Averages smooth away that variation.
Exam-board figures are not school-effect estimates
AQA and OCR publish specification-level results statistics, while Ofqual and JCQ provide wider national reporting. These figures help describe outcomes, but raw comparisons between Edexcel, AQA, OCR or Eduqas should not be treated as league tables of difficulty.
Candidate populations differ, and grade boundaries are set within each qualification. Your exam-board specification and mark scheme should guide your revision, not an unsupported belief that another board is automatically easier.
 A student investigates context before leaping from a chart to a claim about cause
What the data does not tell you
The published results do not tell us that private schooling alone produces higher Computer Science grades. They also do not tell us:
- what each candidate’s prior attainment was;
- how much progress candidates made during the course;
- how schools decided who could take Computer Science;
- how much curriculum time or specialist teaching each group received;
- whether differences remain after adjusting for pupil and school characteristics;
- what grade a particular student is likely to achieve.
This is the distinction between correlation and causation. If school type and results are associated, that does not establish school type as the cause. Other variables may influence both.
It is also an example of the ecological fallacy: assuming that a group average must describe every individual within the group. An independent-school average does not guarantee a high grade, just as a comprehensive-school average does not impose a ceiling.
The GCSE Maths revision hub contains free lessons and questions on percentages, probability, sampling and statistics: the same tools needed to read education data critically.
How this connects to your maths revision
The most useful question is not, “What does my school category predict?” It is, “Where am I currently losing marks, and what action changes that?”
Start with evidence from your own work:
- Complete a short set or paper under realistic conditions.
- Mark it carefully rather than looking only at the total.
- Separate knowledge gaps from accuracy errors and misread questions.
- Revise one weak topic using a lesson and focused practice questions.
- Retest the topic after a short gap.
- Move towards full timed papers as the examinations approach.
MathsGenie’s guide to when to start GCSE past papers explains how to progress from targeted practice to timed papers. If your revision feels scattered, use the GCSE maths revision timetable or a structured one-month revision plan.
This approach is less dramatic than comparing school sectors. It is also more useful. Your marked work contains information about your next mark; a national category average usually does not.
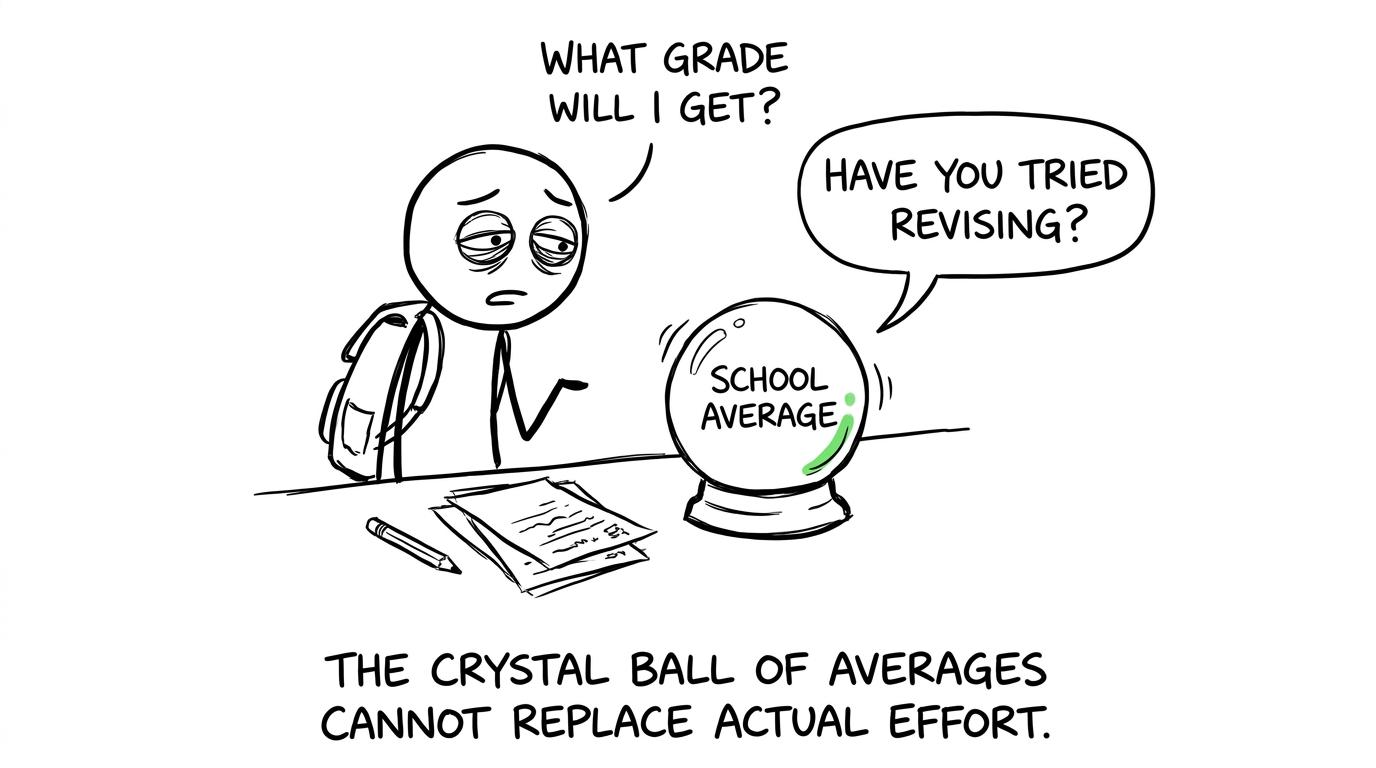 A school average crystal ball gives a GCSE student unexpectedly practical revision advice
Common mistakes when interpreting school results
Treating percentage points as percentage change
A movement from one percentage to another can be described in percentage points or as a relative percentage change. They are not interchangeable. Always check which measure a claim uses.
Comparing unequal groups as though they were identical
State-funded centres educate far more pupils and include several different school types. A two-column comparison can hide selective schools, comprehensives, academies and other settings inside one average.
Ignoring who entered the subject
Computer Science results cover candidates who were actually entered. They do not represent every pupil attending each type of school.
Assuming correlation proves causation
A gap may be real without revealing its cause. Prior attainment, admissions, subject selection and resources can all affect the observed relationship.
Using one year as a permanent rule
Entry patterns and grade outcomes change. Ofqual also adjusted grading in GCSE Computer Science in 2024 at key grade boundaries following research into the subject’s grading severity. This makes historical comparisons especially dependent on context.
Letting an average become a prediction
Averages summarise groups. They do not set your grade. Use MathsGenie’s exam-board and tier topic guide to identify what your own maths paper requires, then use actual practice to measure progress.
A better conclusion than “private schools do better”
The broad GCSE figures show a clear independent-school advantage over non-selective state schools at major grade thresholds. They also show that selective state schools complicate any simple state-private story. For Computer Science specifically, national outcomes tell us how candidates performed overall, while centre-type data must be interpreted alongside entry policies, prior attainment and cohort composition.
The honest answer is therefore measured: school-type differences are visible, but the headline data does not identify a pure school-type effect or determine an individual result.
Your most valuable dataset is the one you can act upon. Open MathsGenie, choose the correct exam board and tier, and turn lost marks into a revision plan. Use free revision lessons and practice questions to repair methods, mini tests to check recall, and past papers with mark schemes and video solutions to build exam technique. Nearer the exam, add predicted-topic and predicted-paper practice without treating predictions as a substitute for the full specification.
School averages describe where groups have been. Careful practice helps decide where you go next.