Question 5
29%Chloe has data about the number of hours 8 students spent revising and their test scores. She was asked to display the data on a scatter graph. Here is her answer.
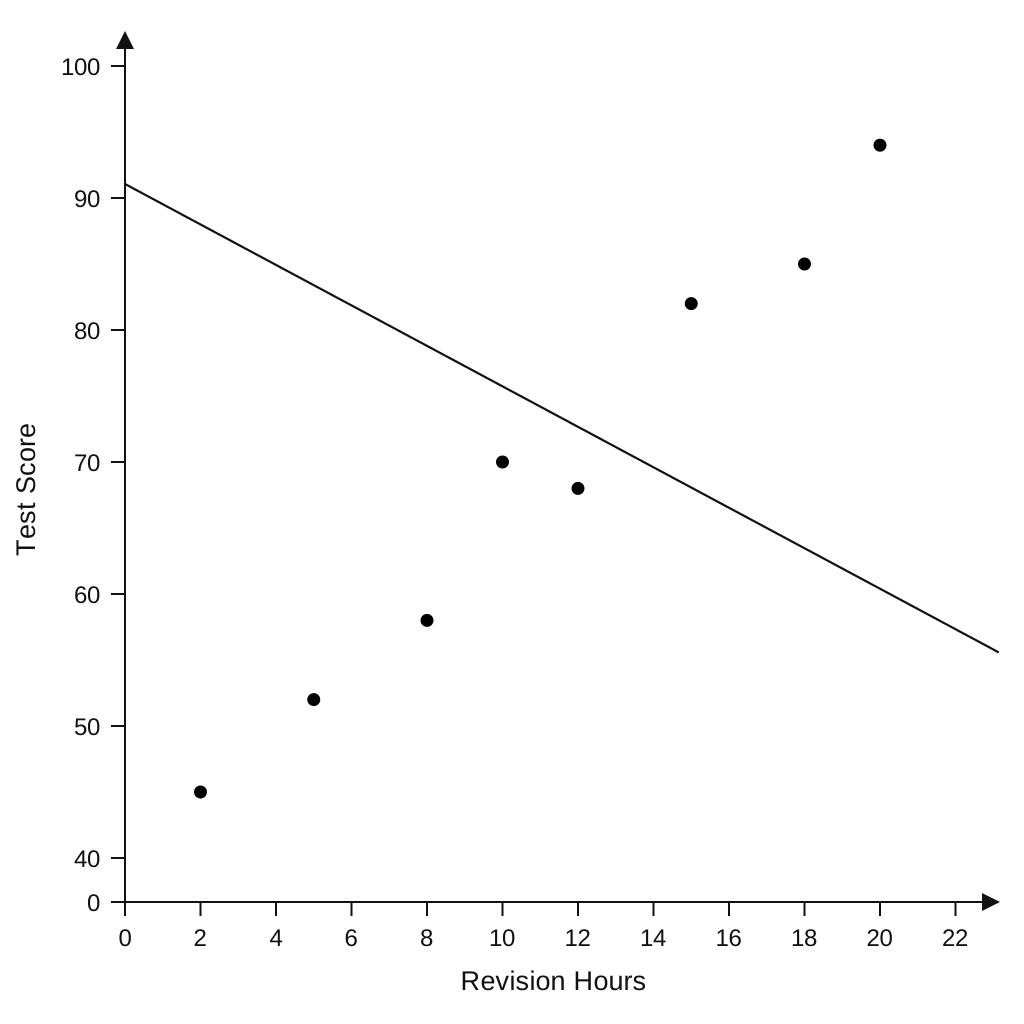
| Revision Hours | Test Score |
|---|---|
| 2 | 45 |
| 5 | 52 |
| 8 | 58 |
| 10 | 70 |
| 12 | 68 |
| 15 | 82 |
| 18 | 85 |
| 20 | 94 |
Chloe has plotted the points accurately.
Write down two things that are wrong with her answer.
Scatter Graphs Questions
55 exam-style questions on Edexcel GCSE Maths Scatter Graphs. Each one has a worked solution and a mark scheme showing where the marks go.