Question 38
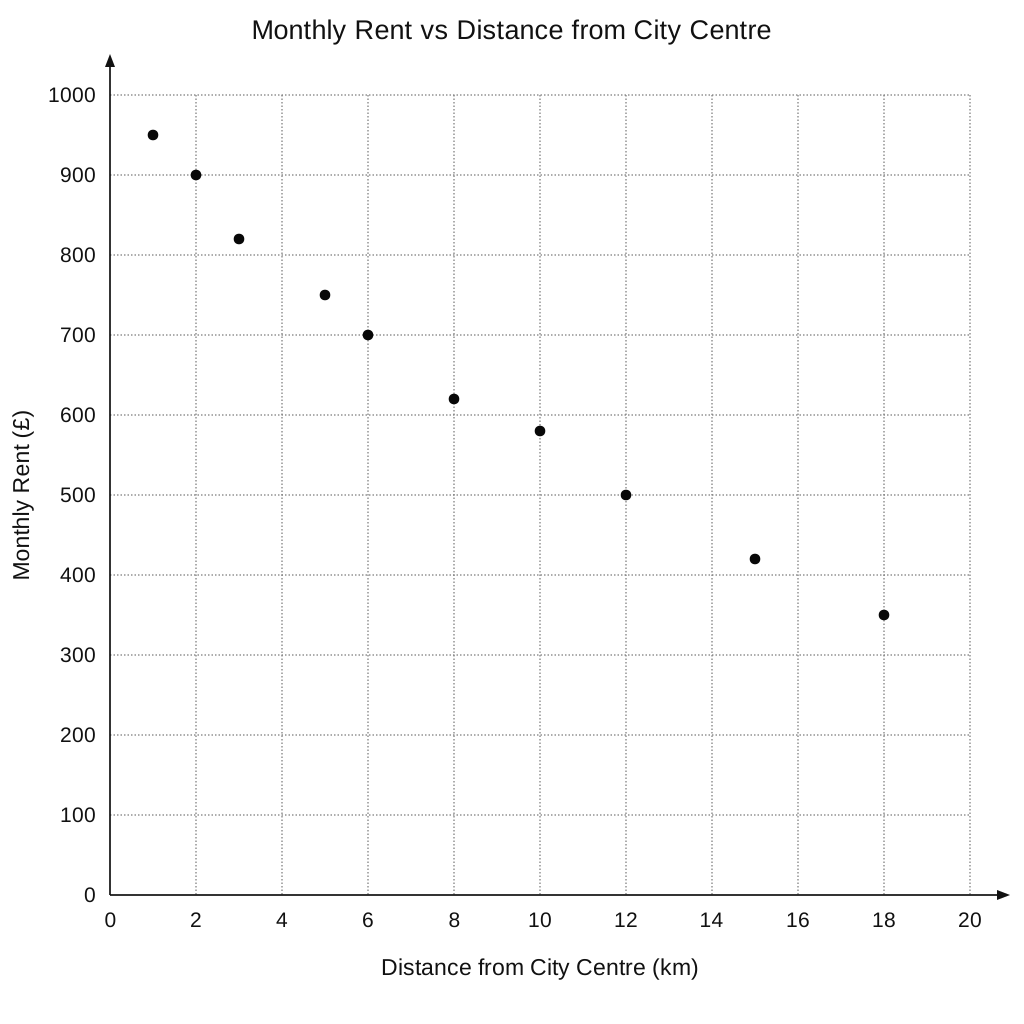
An estate agent recorded the distance from the city centre and the monthly rent for 10 similar apartments. The information is shown on the scatter graph.
| Distance (km) | Monthly Rent (£) |
|---|---|
| 1 | 950 |
| 2 | 900 |
| 3 | 820 |
| 5 | 750 |
| 6 | 700 |
| 8 | 620 |
| 10 | 580 |
| 12 | 500 |
| 15 | 420 |
| 18 | 350 |
a.[1]
What type of correlation does the scatter graph show?
b.[2]
Another apartment has a monthly rent of £650. Estimate the distance this apartment is from the city centre.
Scatter Graphs Questions
55 exam-style questions on Edexcel GCSE Maths Scatter Graphs. Each one has a worked solution and a mark scheme showing where the marks go.