Question 26
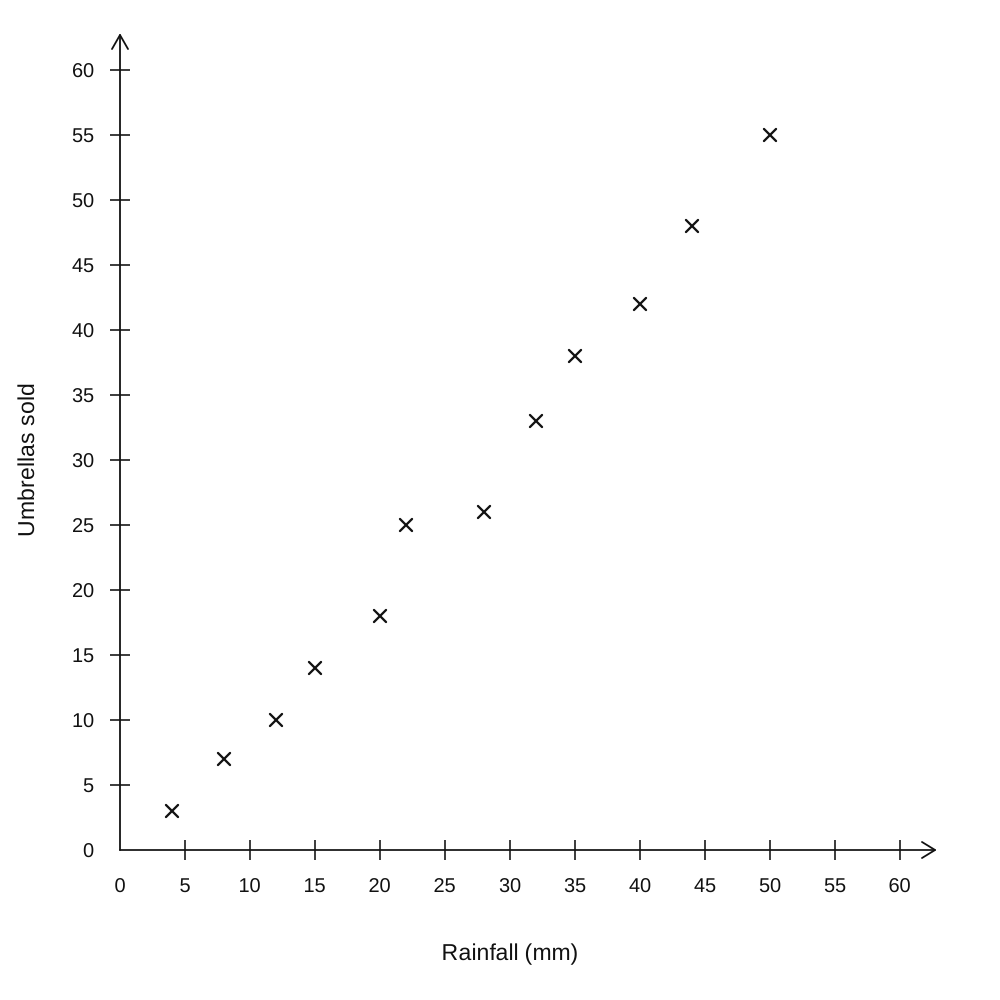
The scatter graph shows the daily rainfall and the number of umbrellas sold at a shop over 12 days.
| Rainfall (mm) | Umbrellas sold |
|---|---|
| 4 | 3 |
| 8 | 7 |
| 12 | 10 |
| 15 | 14 |
| 20 | 18 |
| 22 | 25 |
| 28 | 26 |
| 32 | 33 |
| 35 | 38 |
| 40 | 42 |
| 44 | 48 |
| 50 | 55 |
a.[1]
What type of correlation does the scatter graph show?
b.[2]
On another day, the rainfall was 27 mm. Estimate the number of umbrellas sold that day.
Scatter Graphs Questions
55 exam-style questions on Edexcel GCSE Maths Scatter Graphs. Each one has a worked solution and a mark scheme showing where the marks go.