Question 1
22%The scatter graph shows the scores of 16 students on their Biology and Physics tests.
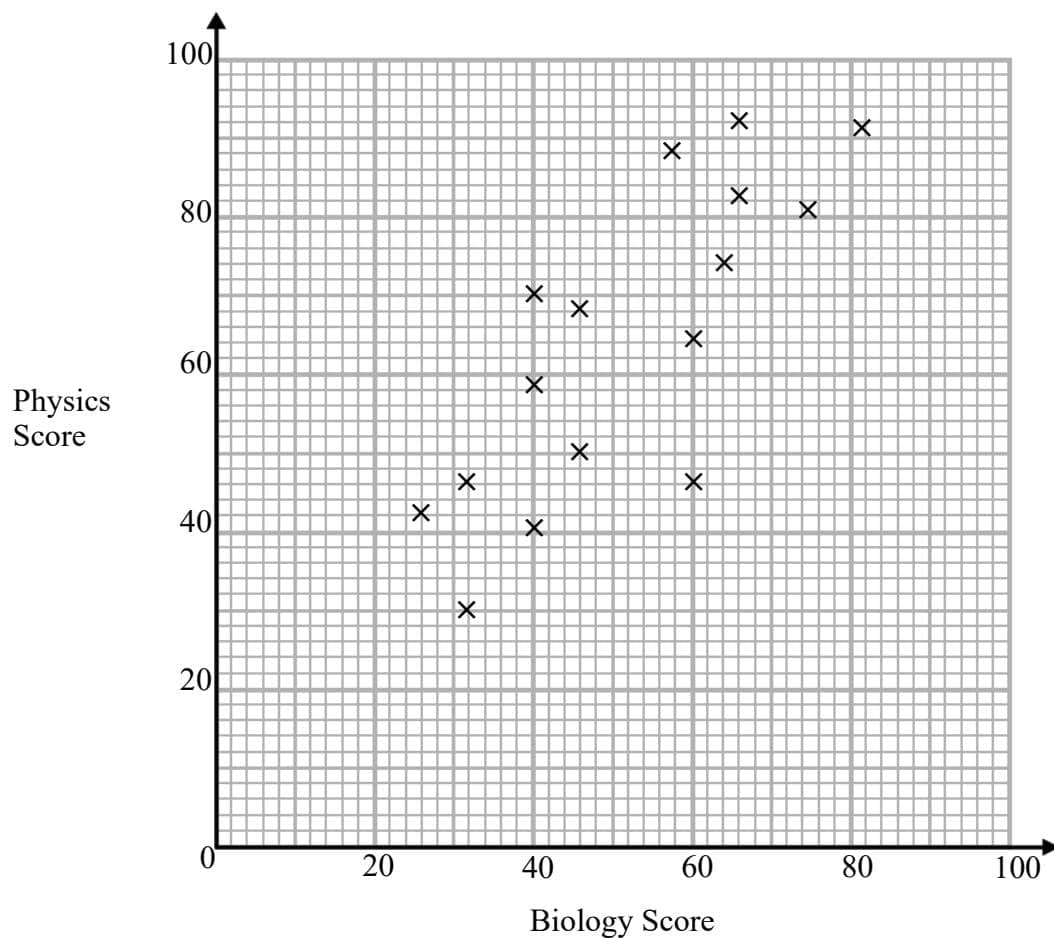
| Biology Score | Physics Score |
|---|---|
| 25 | 41 |
| 30 | 29 |
| 31 | 45 |
| 38 | 39 |
| 39 | 57 |
| 39 | 69 |
| 45 | 48 |
| 45 | 67 |
| 57 | 87 |
| 60 | 45 |
| 60 | 63 |
| 63 | 73 |
| 65 | 82 |
| 65 | 91 |
| 73 | 80 |
| 80 | 90 |
a.[1]
What type of correlation does the scatter graph show?
b.[2]
Another student scored 52 marks on their Biology test. Estimate the Physics score for this student.
Scatter Graphs Questions
55 exam-style questions on Edexcel GCSE Maths Scatter Graphs. Each one has a worked solution and a mark scheme showing where the marks go.