Question 4
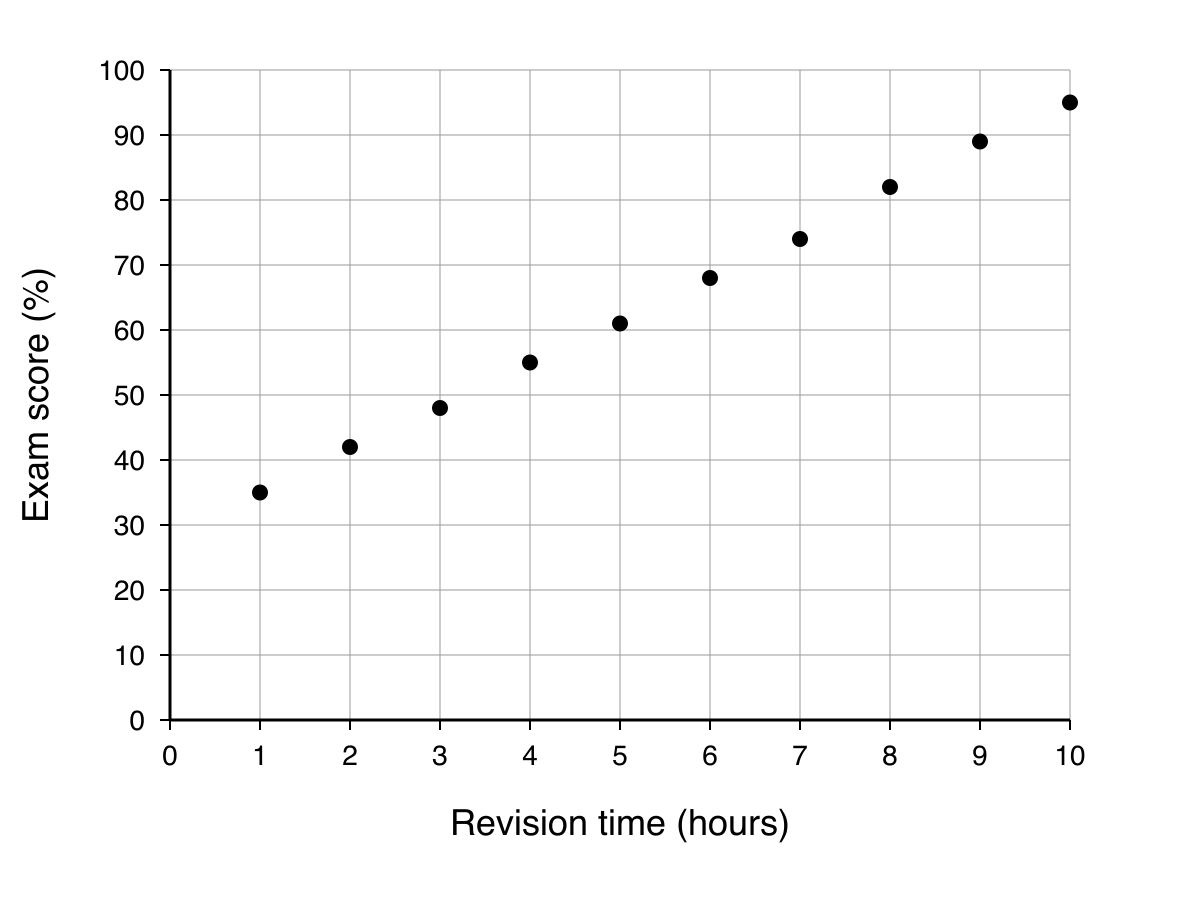
29%Sarah recorded the number of hours 10 students spent revising for an exam. She also recorded their exam scores as a percentage. The information is shown on the scatter graph.
| Revision Time (hours) | Exam Score (%) |
|---|---|
| 1 | 35 |
| 2 | 42 |
| 3 | 48 |
| 4 | 55 |
| 5 | 61 |
| 6 | 68 |
| 7 | 74 |
| 8 | 82 |
| 9 | 89 |
| 10 | 95 |
a.[1]
What type of correlation does the scatter graph show?
b.[2]
Another student achieved an exam score of 70%. Estimate the number of hours this student spent revising.
Scatter Graphs Questions
55 exam-style questions on Edexcel GCSE Maths Scatter Graphs. Each one has a worked solution and a mark scheme showing where the marks go.