Question 44
The scatter graph shows information about the test scores of some students in Maths and English.
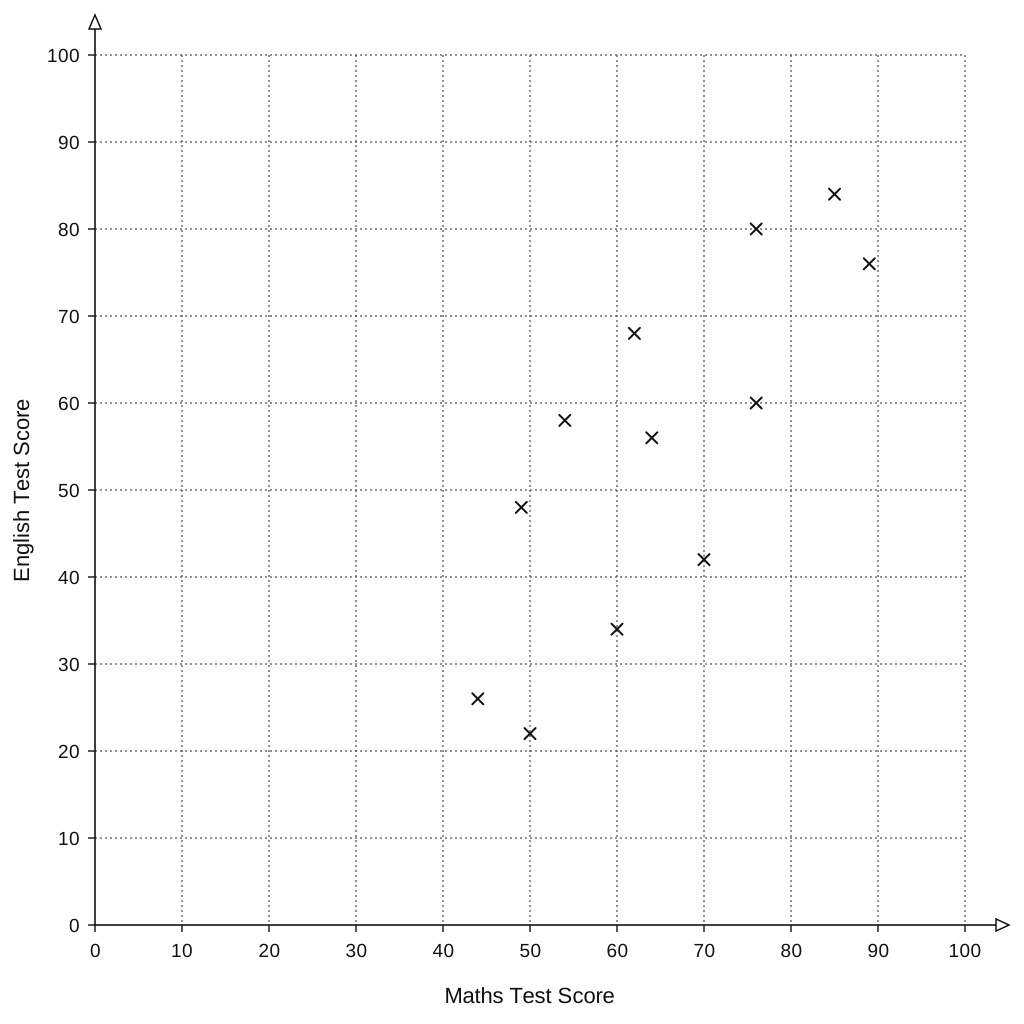
| English Test Score | Maths Test Score |
|---|---|
| 22 | 50 |
| 26 | 44 |
| 34 | 60 |
| 42 | 70 |
| 48 | 49 |
| 56 | 64 |
| 58 | 54 |
| 60 | 76 |
| 68 | 62 |
| 76 | 89 |
| 80 | 76 |
| 84 | 85 |
The table shows the test scores of two more students.
| Maths Test Score | 70 | 84 |
| English Test Score | 64 | 68 |
a.[1]
Show this information on the scatter graph.
b.[2]
Another student scored 56 on the maths test. Use the scatter graph to estimate this student's score on the English test.
Scatter Graphs Questions
55 exam-style questions on Edexcel GCSE Maths Scatter Graphs. Each one has a worked solution and a mark scheme showing where the marks go.