Question 17
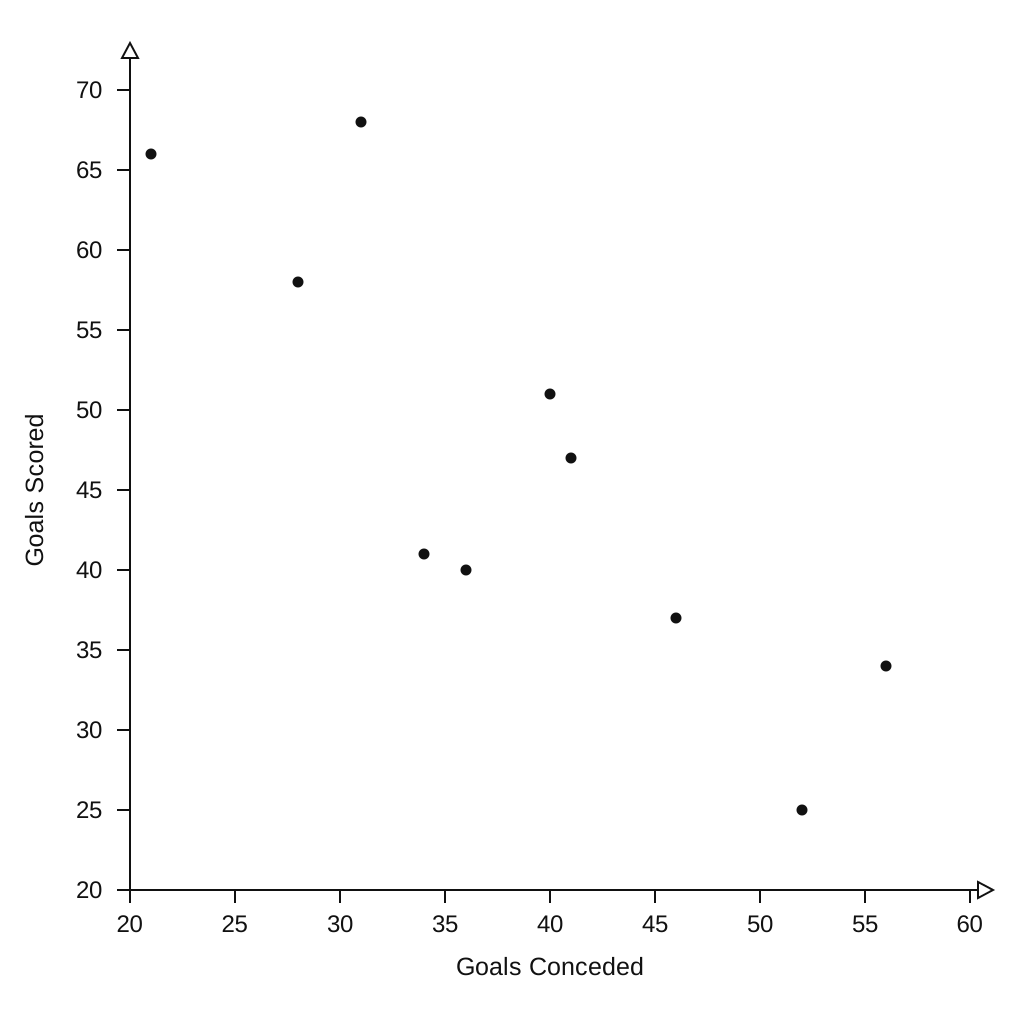
Gary recorded how many goals 10 football teams scored. He also recorded how many goals they conceded. The information is shown on the scatter graph.
| Goals Conceded | Goals Scored |
|---|---|
| 21 | 66 |
| 28 | 58 |
| 31 | 68 |
| 34 | 41 |
| 36 | 40 |
| 40 | 51 |
| 41 | 47 |
| 46 | 37 |
| 52 | 25 |
| 56 | 34 |
a.[1]
What type of correlation does the scatter graph show?
b.[2]
Another team have scored 44 goals. Estimate the number of goals this team has conceded.
Scatter Graphs Questions
55 exam-style questions on Edexcel GCSE Maths Scatter Graphs. Each one has a worked solution and a mark scheme showing where the marks go.