Question 42
The scatter graph shows information about the years of experience and the monthly salary (in £1000 \pounds 1000\,£1000s) of some employees at a company.
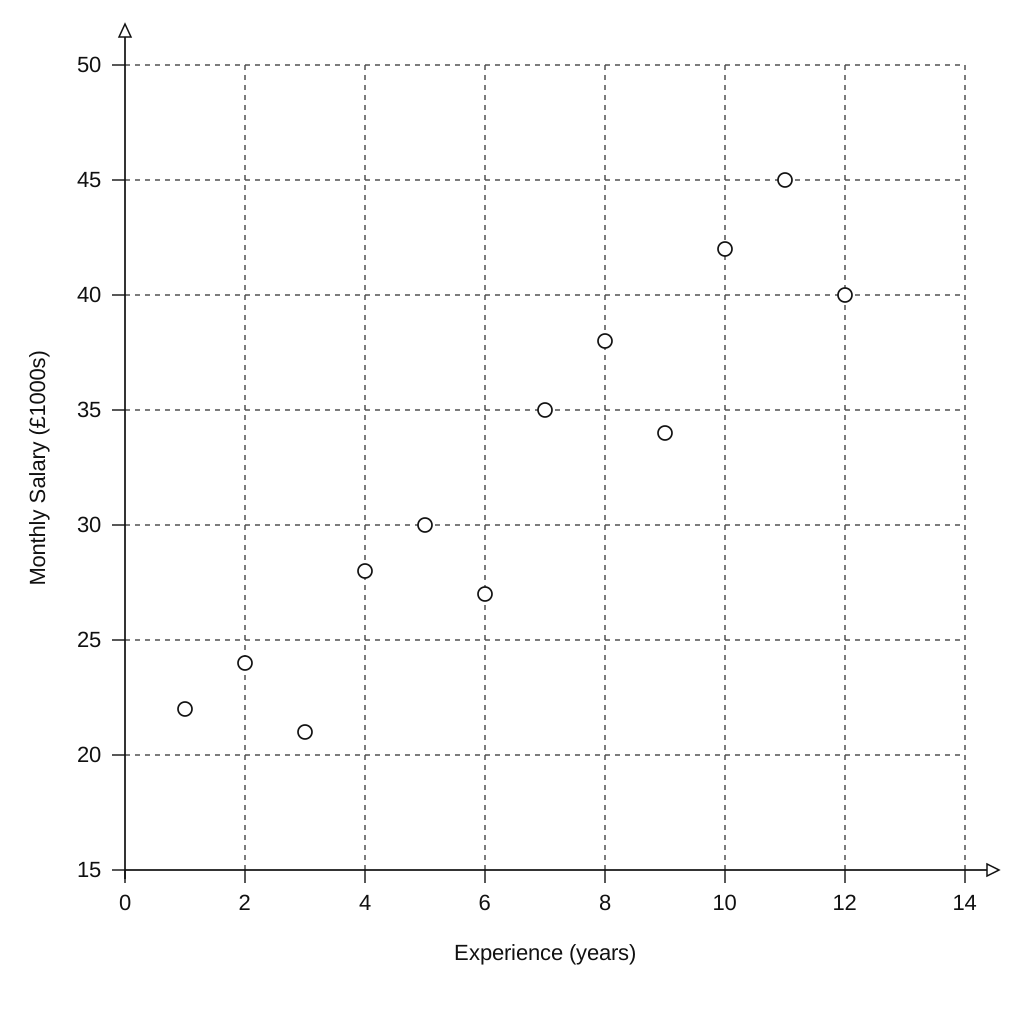
| Experience (years) | Monthly Salary (£1000 \pounds 1000\,£1000s) |
|---|---|
| 1 | 22 |
| 2 | 24 |
| 3 | 21 |
| 4 | 28 |
| 5 | 30 |
| 6 | 27 |
| 7 | 35 |
| 8 | 38 |
| 9 | 34 |
| 10 | 42 |
| 11 | 45 |
| 12 | 40 |
The table shows the data for two more employees.
| Monthly Salary (£1000 \pounds 1000\,£1000s) | 32 | 48 |
| Experience (years) | 6 | 13 |
a.[1]
Show this information on the scatter graph.
b.[2]
Another employee has a monthly salary of £36,000\pounds 36,000£36,000. Use the scatter graph to estimate this employee's years of experience.
Scatter Graphs Questions
55 exam-style questions on Edexcel GCSE Maths Scatter Graphs. Each one has a worked solution and a mark scheme showing where the marks go.