Question 23
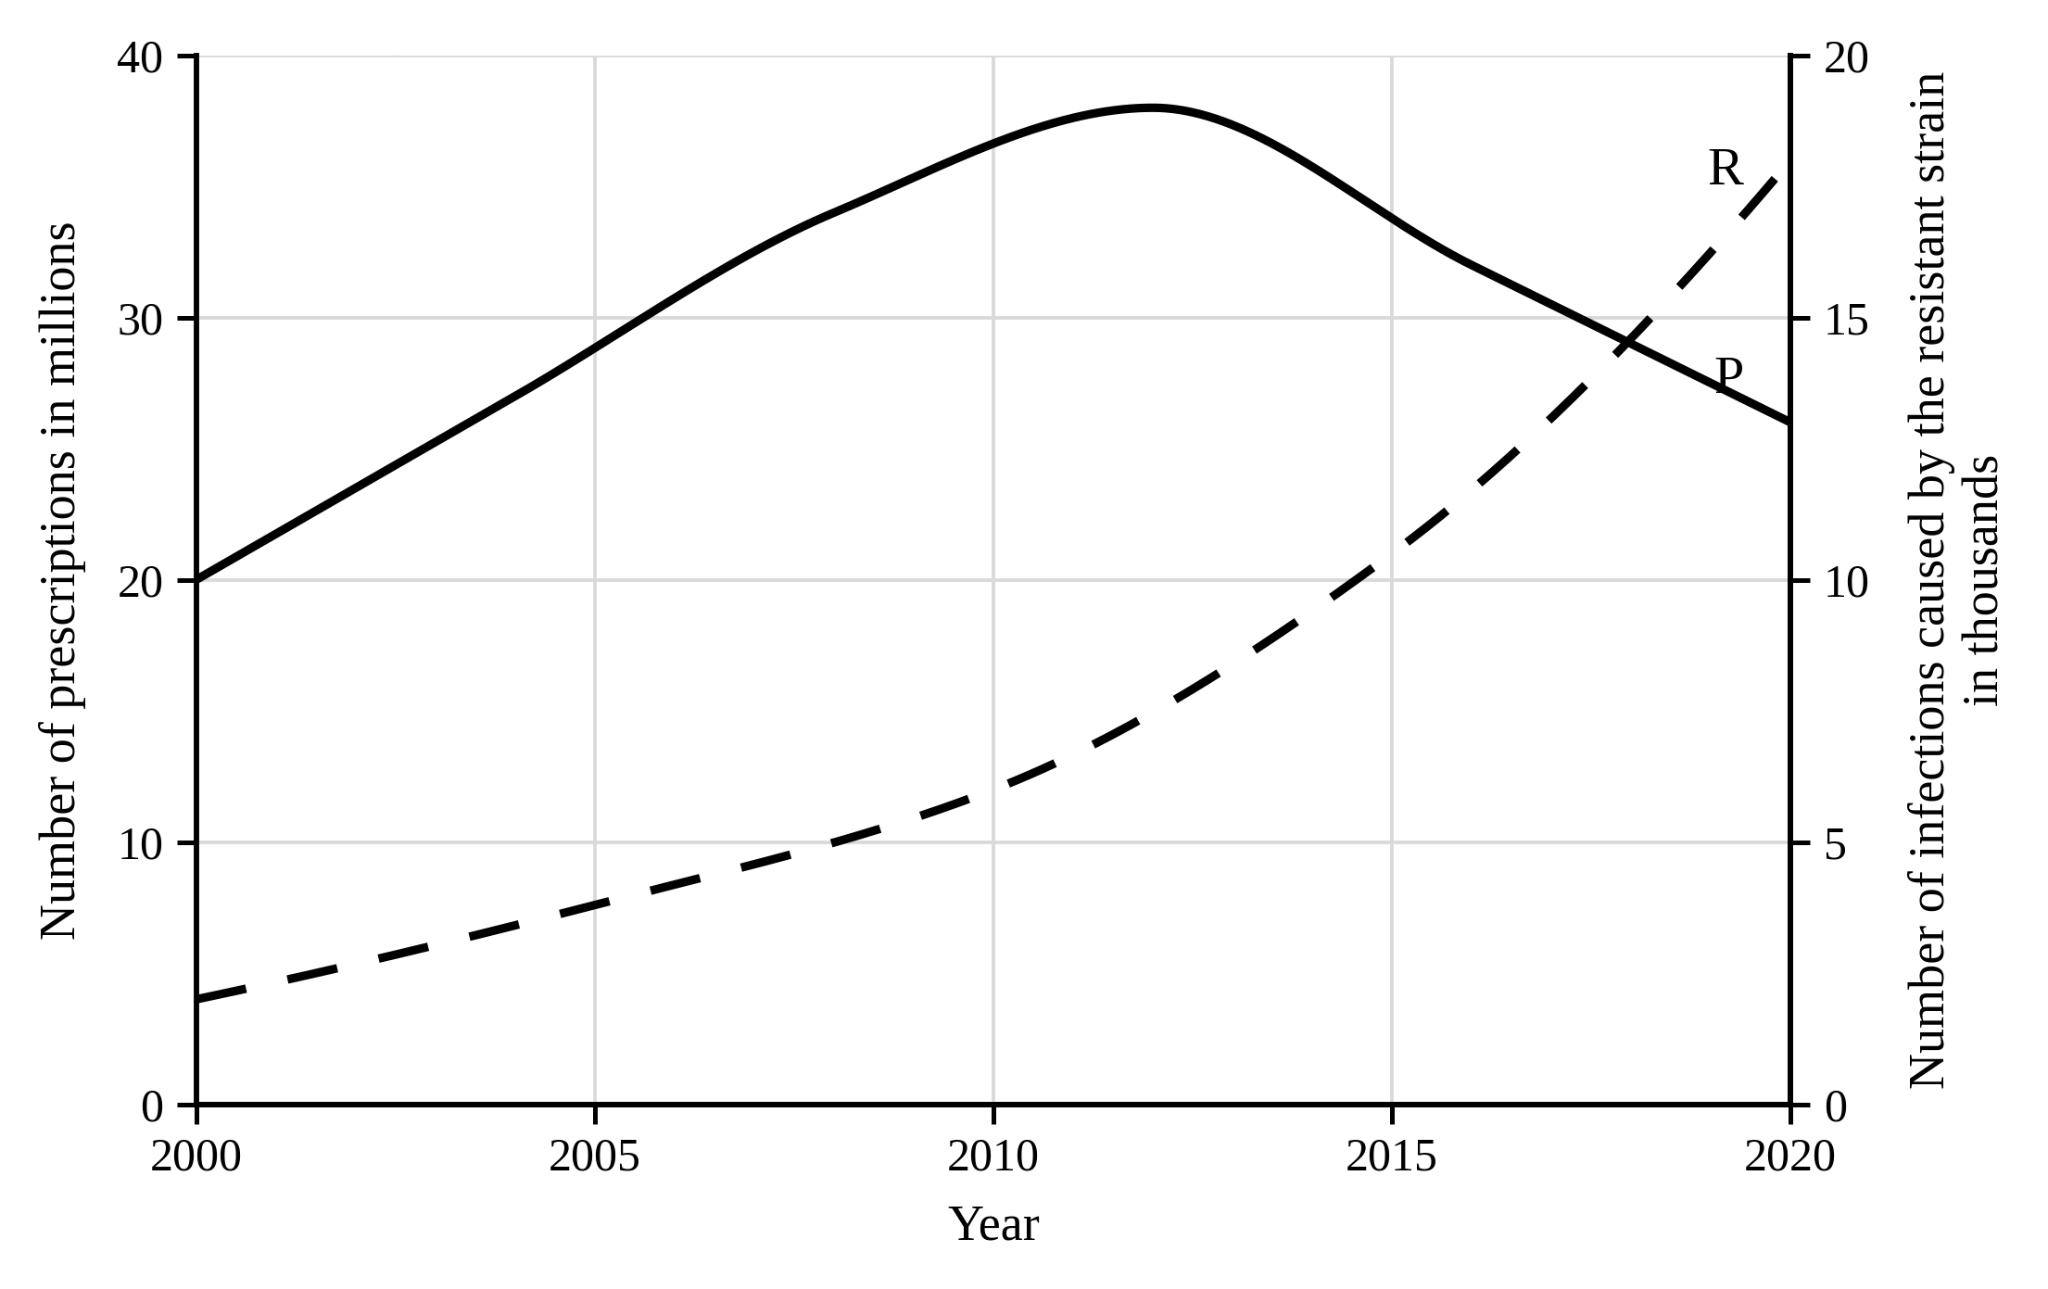
FThe figure shows the number of prescriptions written for one antibiotic and the number of infections caused by a strain of bacterium that is resistant to that antibiotic, in one country between 2000 and 2020.
Figure: The number of prescriptions for one antibiotic and the number of infections caused by a resistant strain of bacterium between 2000 and 2020
a.[2]
Describe the trend shown by curve R between 2000 and 2020.
b.[3]
Explain how the prescribing of this antibiotic has led to the increase shown by curve R.
c.[1]
Prescriptions fell after 2012 but the number of resistant infections continued to rise. Suggest one reason why.
d.[1]
A student concluded that prescribing this antibiotic is the only cause of the rise in resistant infections. Give one reason why this conclusion is not valid.
3.1 Communicable diseases Questions
176 exam-style questions on AQA GCSE Biology 3.1 Communicable diseases, covering 3.1.1 Communicable (infectious) diseases, 3.1.2 Viral diseases, 3.1.3 Bacterial diseases, 3.1.4 Fungal diseases, 3.1.5 Protist diseases, 3.1.6 Human defence systems, 3.1.7 Vaccination, 3.1.8 Antibiotics and painkillers, and 3.1.9 Discovery and development of drugs. Each one has a worked solution and a mark scheme showing where the marks go.