GCSE Statistics 5 to 7: A Practical Grade Guide
GCSE statistics 5 to 7: discover the skills, exam habits and focused revision changes that turn secure knowledge into stronger Grade 7 answers consistently.
A grade 5 often feels close to a grade 7. You recognise most of the topics, your calculator work is usually sound, and many questions seem familiar. Yet marks keep disappearing in comparisons, conclusions and unfamiliar contexts.
The route from GCSE statistics 5 to 7 is not simply to learn more facts. It is to become more selective, precise and critical. Grade 7 answers tend to connect calculations to context, justify statistical choices and evaluate the reliability of conclusions. You need secure methods, but you also need to think like a statistician.
There is one practical point to check immediately. In the current Pearson Edexcel GCSE Statistics specification, Foundation tier offers grades 1 to 5, while Higher tier offers grades 4 to 9, with a possible grade 3 just below the grade 4 boundary. If grade 7 is your target, confirm that you are entered for Higher tier and use resources matching your specification.
Your grade 5 to grade 7 checklist
The most effective plan is built around six changes:
- secure routine calculations so they do not consume unnecessary time;
- master Higher-tier representations such as histograms, cumulative frequency diagrams and box plots;
- compare both the centre and spread of distributions;
- write conclusions in context and support them with evidence;
- evaluate samples, questionnaires, graphs and claims critically;
- mark practice carefully, record why marks were lost and retest weak skills.
Begin with the GCSE Statistics revision hub, then select your exam board and qualification. Pearson students can go directly to the Edexcel GCSE Statistics revision page for lessons, questions, worksheets and papers.
What separates a grade 5 from a grade 7?
No single question is labelled a “grade 7 question”, and grade boundaries change between exam series. The final grade comes from your total mark across the qualification, not from passing separate topic levels.
For perspective, Pearson’s June 2025 Higher-tier boundary was 424242 marks out of 160160160 for grade 5 and 808080 marks for grade 7. Those figures must not be treated as permanent targets: boundaries are set for each series to reflect the demand of the papers. They do, however, show that moving up requires a substantial collection of extra marks rather than one spectacular final answer.
The difference usually appears in how knowledge is used.
| A secure grade 5 response often… | A developing grade 7 response also… |
|---|---|
| Calculates a mean or median | Chooses the more suitable measure and explains why |
| Reads a graph accurately | Questions its scale, construction and possible distortion |
| Identifies correlation | Describes its direction and strength, comments on outliers and avoids claiming causation |
| Finds the range | Uses the interquartile range or another appropriate measure of spread |
| Draws a conclusion | Supports it with statistics, context and a limitation |
| Recognises a sample | Evaluates its size, selection method, bias and representativeness |
Pearson currently places about 55%55\%55% of the qualification on demonstrating knowledge and understanding, about 25%25\%25% on interpreting and analysing statistical information, and about 20%20\%20% on evaluating processes and conclusions. The exact permitted variation is stated in the specification. This helps explain why calculation practice alone has a ceiling: a sizeable part of the assessment rewards reasoning.
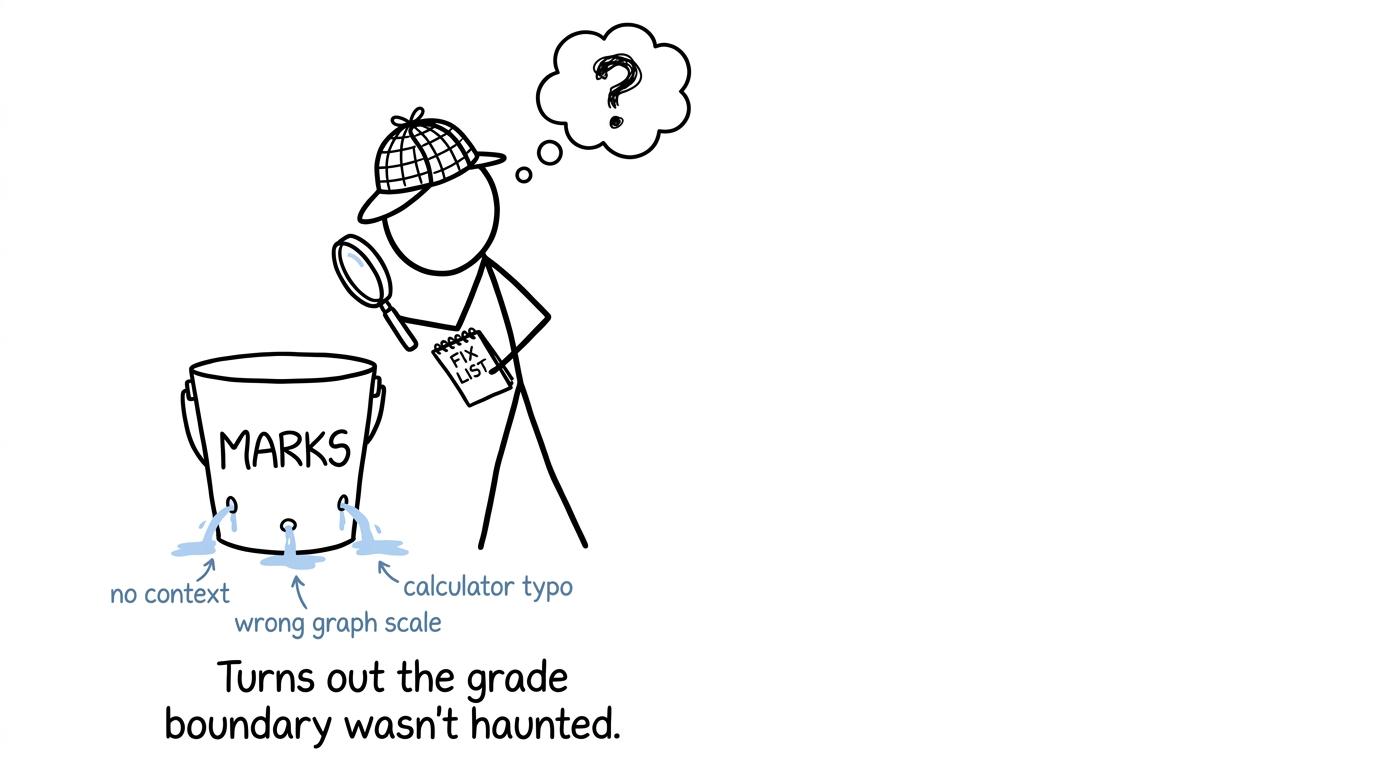 A student detective finds where statistics marks are leaking
Make routine techniques automatic
Grade 7 reasoning rests on grade 5 accuracy. If every average, percentage or probability takes intense concentration, little attention remains for interpretation.
Prioritise the techniques that connect to longer questions:
- averages from lists, tables and grouped data;
- range, quartiles, percentiles and interquartile range;
- frequency tables and cumulative frequencies;
- scatter diagrams, correlation and lines of best fit;
- sampling methods, bias and questionnaire design;
- probability, including combined events where required;
- index numbers, time series and moving averages where included in your specification.
Know what the formulas mean, not only how to enter them into a calculator. For example,
IQR=Q3−Q1\operatorname{IQR}=Q_3-Q_1IQR=Q3−Q1measures the spread of the middle 50%50\%50% of the data. That makes it less sensitive to extreme values than the range. This interpretation is what allows you to choose and compare statistics intelligently.
Use short, closed-book practice. Complete a small set, mark it immediately and redo every incorrect question without looking at the solution. MathsGenie’s GCSE maths topics by board and tier can also help you identify overlapping statistics skills in Edexcel, AQA, OCR and Eduqas GCSE Maths specifications.
Strengthen graphical and distribution skills
Higher-tier statistics often asks you to move between a table, graph and written conclusion. Treat these as different views of the same data rather than separate topics.
For cumulative frequency, remember the key positions for a total frequency of NNN:
Q1:N4,median:N2,Q3:3N4.Q_1:\frac{N}{4},\qquad \text{median}:\frac{N}{2},\qquad Q_3:\frac{3N}{4}.Q1:4N,median:2N,Q3:43N.Plot cumulative frequencies against upper class boundaries and check that the final cumulative frequency equals the total. The cumulative frequency revision guide explains the complete process, while the cumulative frequency and box plots worksheet provides focused exam-style practice.
For histograms, the central relationship is
frequency density=frequencyclass width.\text{frequency density}=\frac{\text{frequency}}{\text{class width}}.frequency density=class widthfrequency.The area of each bar represents frequency. A tall bar does not necessarily represent the largest group if class widths differ.
Box plots require more than accurate drawing. In a comparison, discuss location using the medians and spread using the interquartile ranges or ranges. Then place both statements in context. The box plots revision guide is useful when your calculations are correct but your comparison language remains vague.
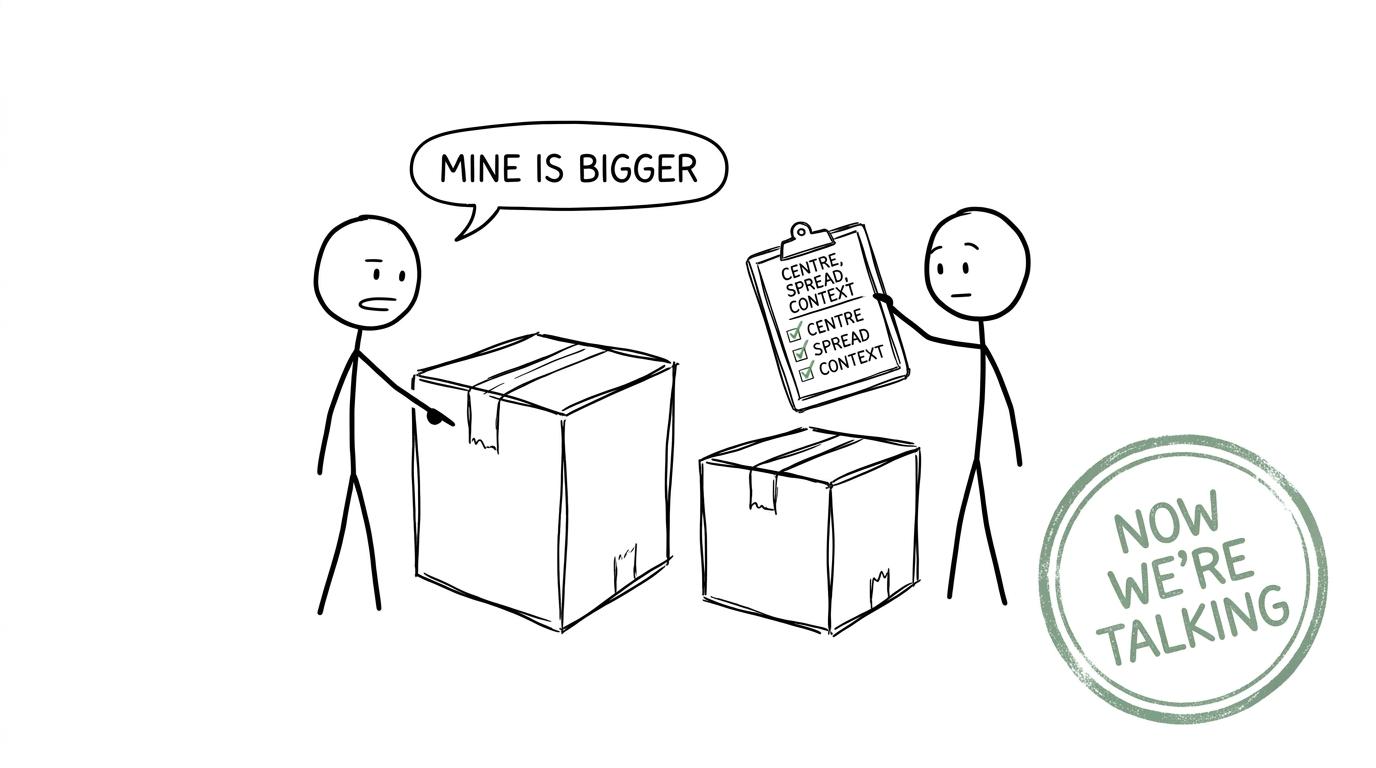 Two students discover that comparing distributions needs more than saying one is bigger
Turn calculations into statistical arguments
This is often the most important change between the two grade bands.
A calculation is evidence, not a conclusion. After obtaining a value, ask:
- What does it describe?
- What comparison does it support?
- Is a second statistic needed?
- How reliable is the evidence?
- What cannot be concluded?
Suppose a question asks you to compare two distributions. A strong structure is:
- compare a measure of location;
- compare a measure of spread;
- quote the relevant values;
- interpret both comparisons in context.
If a scatter diagram shows correlation, do not automatically claim that one variable causes the other. Correlation describes an association. A third variable, the method of collection or coincidence may affect the pattern. Avoid extrapolation beyond the observed data unless the question gives a sound reason for it.
With surveys, evaluate the complete chain: target population, sampling frame, sampling method, sample size, non-response, question wording and timing. “The sample is biased” is rarely enough. State the likely source of bias and explain how it could affect the results.
Build revision around lost marks
Reading notes can make a topic feel familiar without making it retrievable. Progress becomes faster when every session produces evidence about what to do next.
Use this cycle:
Diagnose
Complete a timed section from a Higher-tier past paper before revising it. Mark it using the official mark scheme and classify each lost mark as:
- a knowledge gap;
- an execution or calculator error;
- weak interpretation;
- an incomplete explanation;
- poor time management.
Repair
Choose one narrow weakness, such as interpreting box plots rather than the broad label “data”. Use a MathsGenie revision lesson, then complete targeted practice questions without notes.
Retest
Return to the same skill after a few days using unfamiliar questions. If you can only answer the exact question you corrected, the method has not yet become flexible.
Mix and time
Once individual topics are secure, combine them in mini tests and paper sections. Full papers develop the judgement needed to decide which technique a question requires. A structured GCSE maths revision timetable can help you balance topic repair with timed practice, while the one-month GCSE revision plan offers a practical framework when exams are approaching.
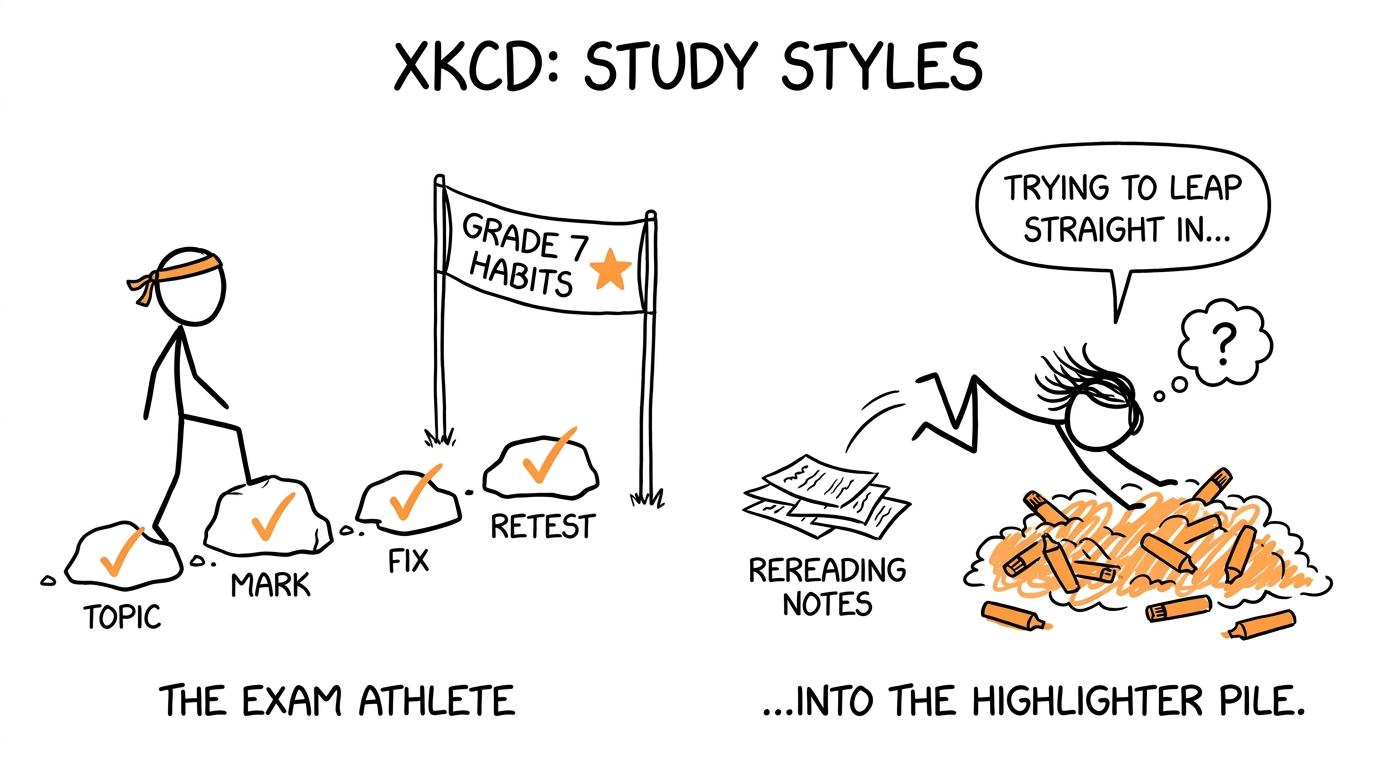 A calm revision loop beats an ambitious leap from rereading to grade 7
Common mistakes that keep students at grade 5
Giving unsupported comparisons
Saying one group is “better” or “more consistent” without quoting statistics leaves the claim unproved. Compare median with median and spread with spread, then explain what the values mean in context.
Confusing frequency with frequency density
In a histogram, bar height represents frequency density and bar area represents frequency. Write down class widths before calculating or reading frequencies.
Treating correlation as causation
A relationship between two variables does not prove that changing one causes the other to change. Use language such as “there is an association” unless causal evidence is provided.
Ignoring command words
“State”, “calculate”, “compare”, “explain” and “evaluate” demand different responses. An evaluation needs a judgement supported by a reason, not a description of what happened.
Rounding too early
Keep full calculator values during intermediate stages and round only the final answer to the requested accuracy. Early rounding can affect later values and conclusions.
Practising without marking
Unmarked practice repeats habits but does not reveal them. Use mark schemes and video solutions to see whether your method, notation and explanation would earn credit.
The path to grade 7 is a change in attention
Moving from grade 5 to grade 7 is less about collecting obscure techniques and more about noticing what the evidence can genuinely support. Secure the calculations. Choose methods deliberately. Compare distributions with values. Challenge weak samples and misleading claims. Then practise those decisions under time pressure.
Start on MathsGenie with the free GCSE Statistics resources. Use revision lessons and practice questions to repair individual skills, mini tests to mix them, and past papers with mark schemes and video solutions to develop exam judgement. As the exam approaches, add suitable predicted papers as fresh practice rather than replacing official past papers.
Your next step is simple: complete one timed Higher-tier section, mark it honestly and identify the three clearest sources of lost marks. That list is not a verdict on your grade. It is your route forward.