GCSE Statistics 20 Minute Study Routine
GCSE statistics 20 minute study routine: build skills in short daily sessions with topic practice, error review and calm exam prep without cramming.
The hardest part of statistics revision is often not calculating a mean or reading a graph. It is starting when homework, lessons and everything else have already taken most of the day.
A GCSE statistics 20 minute study routine solves that problem by making revision small enough to begin. Spend a few minutes recalling earlier learning, review one skill, answer exam questions and mark them immediately. Then stop. Repeated across the week, those short sessions cover the specification without pushing everything into one exhausting evening.
The routine is simple:
- 222 minutes retrieving knowledge from memory
- 666 minutes reviewing one focused skill
- 999 minutes answering questions without notes
- 333 minutes marking and recording mistakes
That is the whole structure. The value comes from repeating it honestly.
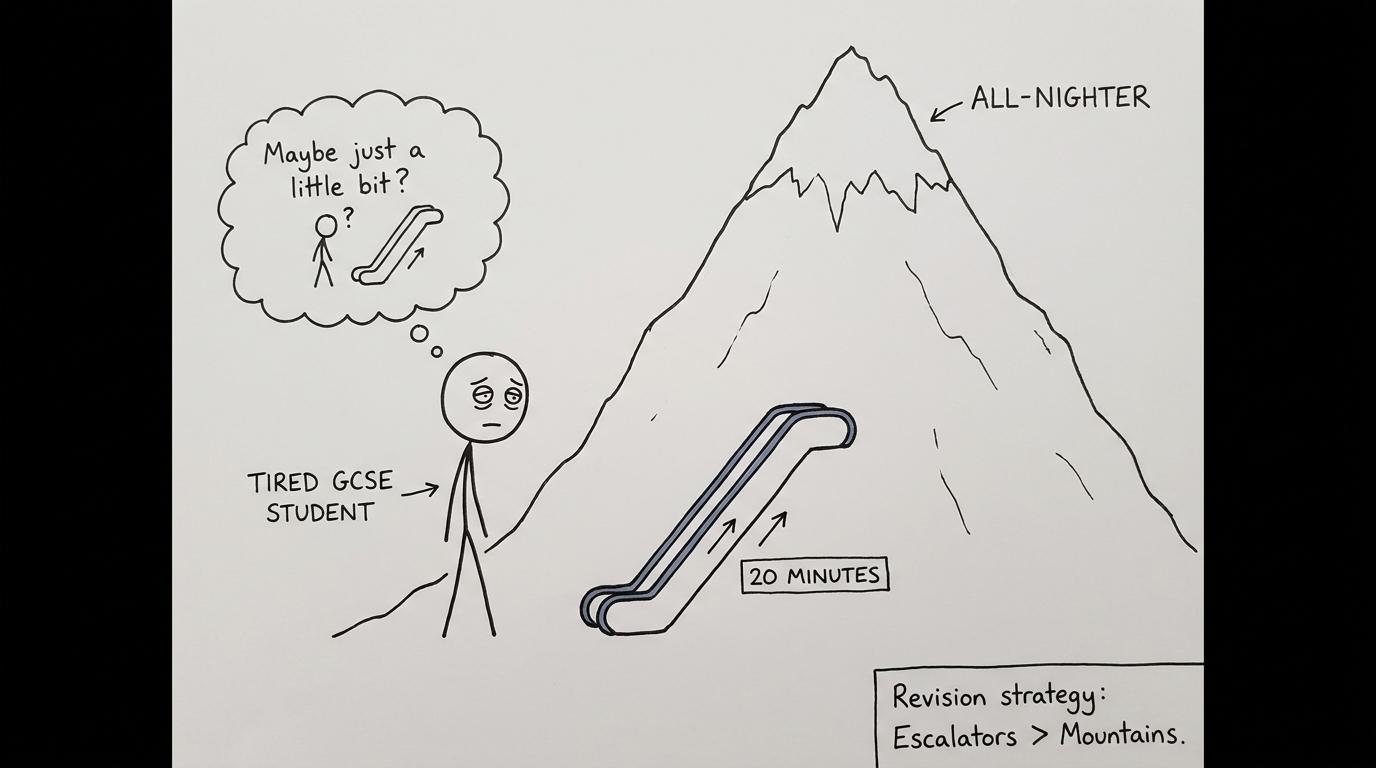 A student choosing a small daily revision escalator instead of climbing the all-nighter mountain
Why short daily statistics revision works
Statistics can feel deceptively familiar. A bar chart looks understandable. The formula for the mean seems memorable. Yet an exam question may ask you to choose an appropriate average, explain a limitation of sampling or compare two distributions in context. Recognition is not the same as being able to produce an answer independently.
Research on learning consistently supports two useful principles: spacing practice across time and retrieving information rather than only rereading it. A short daily routine combines both. You return to ideas over several days, and you repeatedly make yourself recall definitions, methods and interpretations.
This does not mean that exactly 202020 minutes is a scientifically perfect duration. It is a practical boundary. It is long enough to complete meaningful work and short enough to fit around a busy school week.
Statistics is also broader than averages. GCSE Maths specifications include data collection, sampling, tables, charts, measures of central tendency and spread, scatter graphs and interpretation. Higher-tier content may include histograms, cumulative frequency diagrams and more demanding comparisons. Students taking the separate GCSE Statistics qualification should use the same routine but follow the precise content listed by their exam board.
Start by selecting the correct course through the GCSE Statistics revision hub. If you are unsure whether you take Edexcel, AQA, OCR, Eduqas or another board, check with your teacher or look at the front of a recent school paper.
Your daily 20-minute statistics routine
Retrieve for 2 minutes
Close your notes. Write down everything you remember about yesterday's topic.
Your retrieval prompt might ask you to define discrete and continuous data, state when the median is preferable to the mean, or explain what correlation does and does not show. You could also sketch the structure of a box plot or recall these core relationships:
mean=sum of the valuesnumber of values\text{mean}=\frac{\text{sum of the values}}{\text{number of values}}mean=number of valuessum of the values range=largest value−smallest value\text{range}=\text{largest value}-\text{smallest value}range=largest value−smallest value interquartile range=Q3−Q1\text{interquartile range}=Q_3-Q_1interquartile range=Q3−Q1Do not worry if recall feels difficult. Difficulty reveals what needs attention. Looking at the answer before trying removes that useful signal.
Review one skill for 6 minutes
Choose one narrow objective rather than an entire chapter. For example:
- calculating averages from a frequency table;
- choosing a suitable statistical diagram;
- identifying misleading graph scales;
- comparing distributions using an average and a measure of spread;
- describing correlation in context;
- explaining limitations of a sample.
Use a short MathsGenie revision lesson or guide, then write the method in your own words. The averages from frequency tables revision guide is useful when you need to distinguish exact data from grouped data. For grouped intervals, remember that the calculated mean is an estimate because the precise values are unknown.
Higher-tier students can use the histograms revision guide to revisit the relationship
frequency density=frequencyclass width.\text{frequency density}=\frac{\text{frequency}}{\text{class width}}.frequency density=class widthfrequency.Keep this stage brief. The purpose is to prepare for independent practice, not to spend the entire session watching explanations.
Practise for 9 minutes
Answer a small set of questions without notes. Exam-style practice matters because statistics questions often assess interpretation alongside calculation.
Show working, label graphs carefully and write explanations in the context given. If a question asks you to compare two distributions, a bare statement such as one group is better is insufficient. Identify the relevant typical value, comment on spread and connect both to the situation.
Students taking Edexcel GCSE Statistics can find targeted questions, worksheets and papers in the Edexcel GCSE Statistics revision area. GCSE Maths students can choose the matching statistics topic from their board's revision pages.
Do not spend all 999 minutes trapped on one question. Mark it with a star, move to another, and return during a later session. The aim is productive struggle, not silent staring.
Mark and log for 3 minutes
Mark the questions straight away. For every lost mark, record one reason:
- missing knowledge;
- incorrect method;
- calculator or arithmetic error;
- graph drawn inaccurately;
- question misread;
- explanation lacked context.
Then write the correction. A mark scheme is not merely a way to count marks; it shows what a complete answer needs. MathsGenie's guide to finding your weakest GCSE topics explains how to turn lost marks into a practical revision list.
Your error log should remain short. One accurate sentence is more useful than copying a full solution you will never reread.
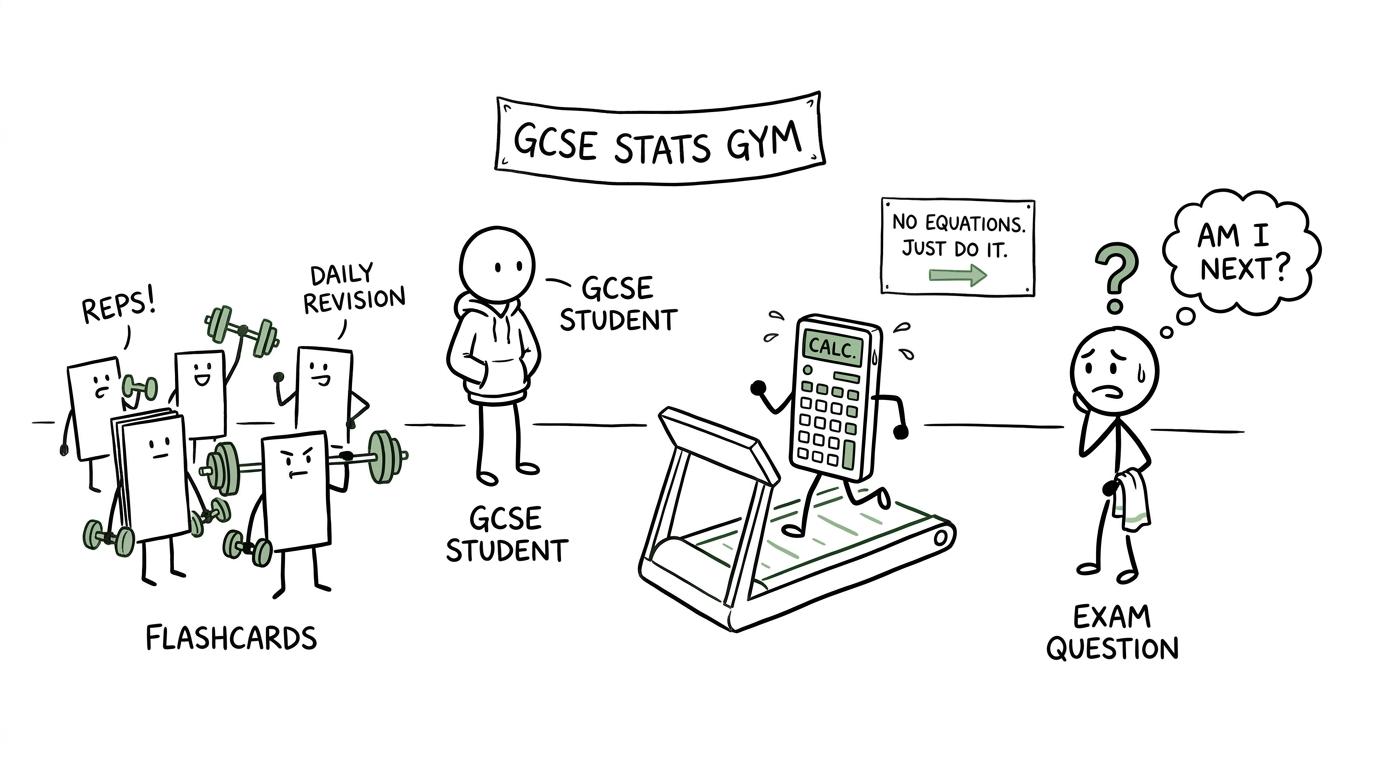 Flashcards and a calculator exercising in a tiny statistics revision gym
A weekly GCSE statistics study plan
A fixed weekly pattern reduces the time spent deciding what to revise. Adjust the topics to match your tier and specification.
| Day | Main focus | Final check |
|---|---|---|
| Monday | Mean, median, mode and range | Can you choose an appropriate average? |
| Tuesday | Data types, sampling and questionnaires | Can you identify bias or a limitation? |
| Wednesday | Charts, graphs and scatter diagrams | Have you checked every scale and label? |
| Thursday | Frequency tables and grouped data | Is the answer exact or estimated? |
| Friday | Mixed retrieval and earlier mistakes | Can you now correct last week's errors? |
| Saturday | Higher-tier extension or a timed section | Did you work without notes? |
| Sunday | Rest, catch-up or planning | Is next week's first task ready? |
Foundation students can use Saturday to strengthen core charts, averages and interpretation rather than forcing higher-only material into the plan. Higher students might rotate between histograms, cumulative frequency, box plots and more complex comparisons.
Probability is a separate strand within GCSE Maths, although it also connects closely with statistics and appears within standalone Statistics courses. Include it only according to your specification. When appropriate, the Venn diagrams revision area and conditional probability revision guide provide focused follow-up practice.
How to adapt the routine as exams approach
Early in revision, most sessions should be topic-based. This gives you enough space to repair individual weaknesses. Once your knowledge becomes more secure, replace one or two weekly sessions with mixed questions from a paper.
A full past paper cannot fit into 202020 minutes, and it should not be squeezed artificially. Instead, use the daily routine to prepare for a separate timed paper at the weekend or during a longer revision block. The guide to starting GCSE past papers explains how to move from topic questions to timed sections and complete papers.
After a paper, divide mistakes into tasks small enough for the daily routine. A weak response on sampling becomes one session on sampling methods. An incorrect histogram becomes one session on class width and frequency density. A vague comparison becomes one session on writing conclusions in context.
This is how a paper becomes useful. The mark is a snapshot; the corrections create progress.
Use predicted papers carefully. They are practice resources, not guarantees of future content. They are most valuable when you sit them under suitable conditions, mark them strictly and return to the topics that cost you marks.
Make the habit easier to keep
Place the session next to an existing part of your day: after arriving home, before dinner or immediately after another homework task. Prepare the worksheet, calculator and mark scheme beforehand so the first minute is not lost searching for resources.
Use a revision planner to name the exact task. Write frequency tables: questions rather than statistics. A precise instruction lowers the effort needed to begin.
If you miss a day, continue with the next planned session. Do not respond by scheduling a punishing catch-up evening. Consistency is built by returning, not by maintaining a perfect record.
Every week, revisit at least one old error. If you can now answer a different question on the same skill without support, the gap is beginning to close. If not, return to the revision lesson and practise again.
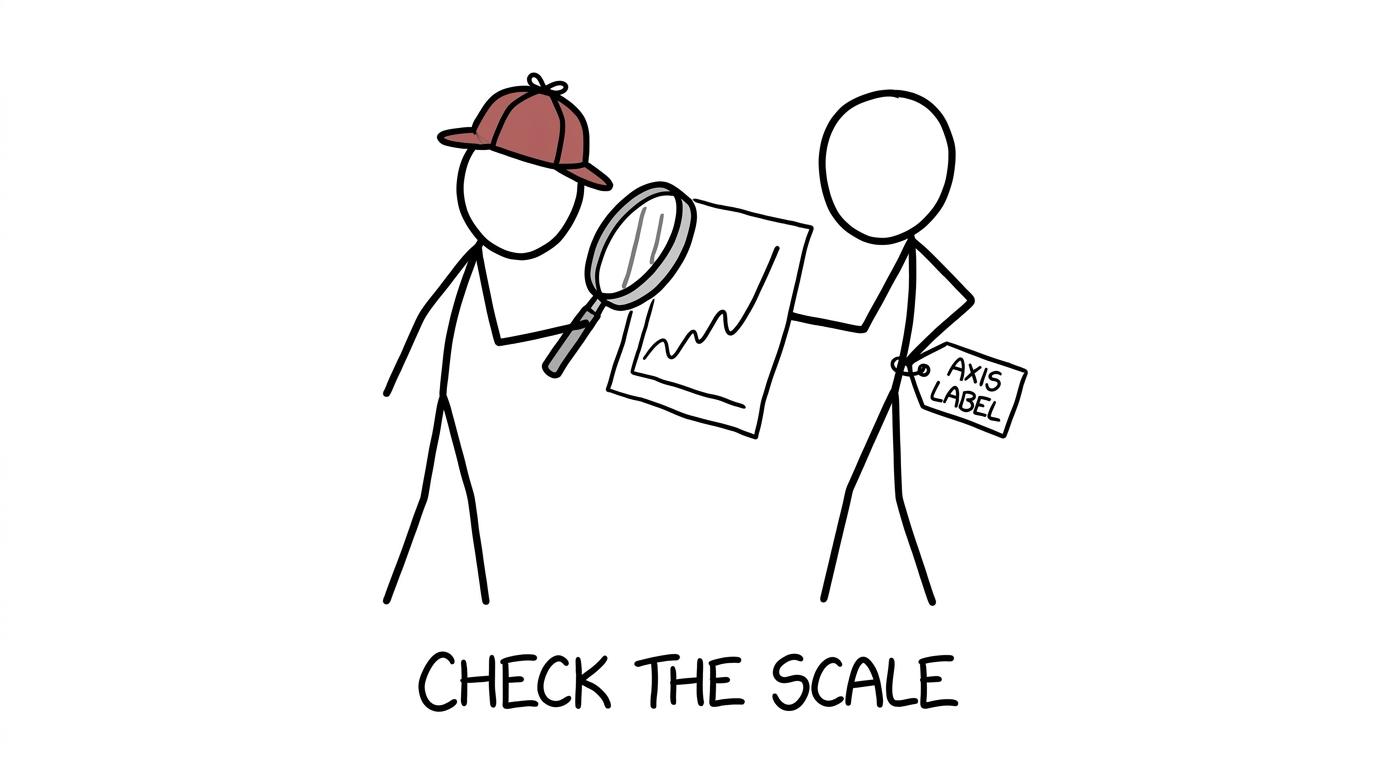 A student detective catching a suspicious graph hiding its axis label
Common mistakes in a 20-minute revision routine
Spending the whole session making notes
Neat notes can feel productive while avoiding the harder task of answering questions. Limit review to 666 minutes and protect the practice time.
Revising only comfortable topics
Confidence matters, but repeatedly calculating simple averages will not repair weak sampling explanations or graph interpretation. Let marked questions decide what comes next.
Treating every graph in the same way
Bar charts, histograms, cumulative frequency graphs, box plots and scatter diagrams communicate different information. Check the data type, axes and purpose before drawing or interpreting anything. In a histogram, frequency is represented by bar area, not automatically by height.
Ignoring written conclusions
Statistics answers often need context. Use the data to support the statement, distinguish correlation from causation, and recognise that a sample may not represent the full population.
Marking without correcting
A cross beside an answer identifies an error but does not repair it. Write the correct method, note why the mark was lost and schedule a fresh question several days later.
Turning a missed day into an all-nighter
The routine exists to avoid cramming. Resume the next day and prioritise the most important unfinished topic. A manageable plan that continues is more useful than an ambitious plan that collapses.
Build calm through repetition
Statistics rewards careful habits: reading scales, selecting appropriate measures, showing calculations and explaining what results mean. Those habits are difficult to manufacture on the night before an exam. They are much easier to build in short, repeated sessions.
Open the MathsGenie GCSE Statistics hub, choose one topic and begin with today's 202020 minutes. Use revision lessons to understand the method, practice questions and mini tests to retrieve it, then past papers and predicted papers to apply it under pressure. Mark schemes and video solutions will show you where the next session should begin.
The goal is not to revise all evening. It is to return tomorrow with one fewer weakness than you had today.