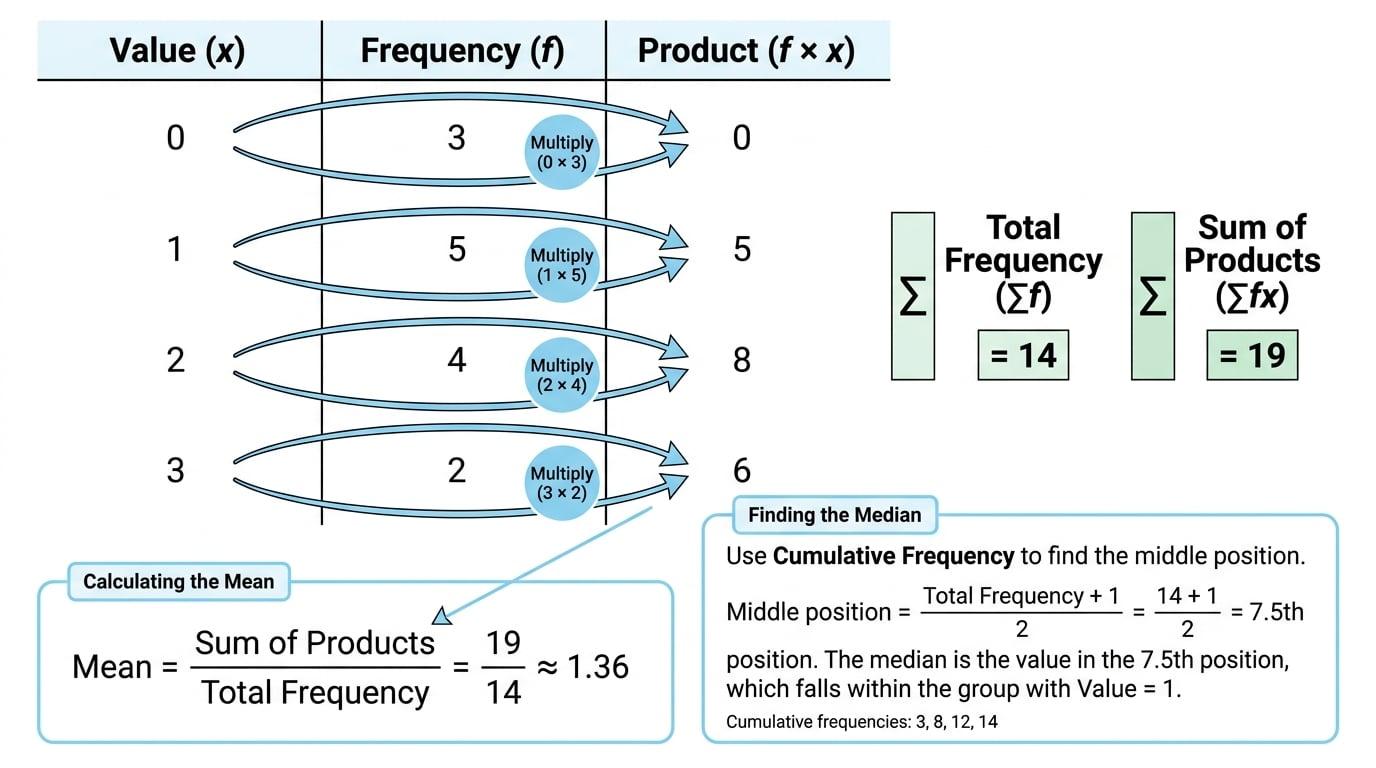
- How to read a frequency table without writing out every value.
- How to calculate the mean from exact data in a table.
- How to find the median and mode using frequencies.
- How to estimate the mean from grouped data using midpoints.
A frequency table is a neat way to show repeated data. Instead of listing every result separately, it tells you how often each result happened.
Frequency
The frequency is how many times a value, score, or group occurs. The total frequency is the total number of items, found by adding all the frequencies.
Reading a frequency table
A small game was played several times.
Find the total number of games played.

-
Add the frequencies, not the point values.
3+5+4+2=143+5+4+2=143+5+4+2=14
-
The total frequency is 14, so 14 games were played.
The mean is the average found by adding all the values and dividing by how many values there are.
In a frequency table, each value may happen lots of times, so you multiply each value by its frequency first.
Mean from a frequency table
For an exact frequency table, use:
mean=total of value-frequency productstotal frequency\text{mean}=\frac{\text{total of value-frequency products}}{\text{total frequency}}mean=total frequencytotal of value-frequency products
Mean points scored
A player recorded these scores.
| Score | Frequency | Product |
|---|
| 0 | 4 | 0 |
| 1 | 6 | 6 |
| 2 | 10 | 20 |
| 3 | 5 | 15 |
| 4 | 2 | 8 |
Find the mean score.

-
Multiply each score by its frequency. The products are shown in the final column.
-
Add the products.
0+6+20+15+8=490+6+20+15+8=490+6+20+15+8=49
-
Add the frequencies.
4+6+10+5+2=274+6+10+5+2=274+6+10+5+2=27
-
Divide the product total by the frequency total.
mean=4927=1.814…\text{mean}=\frac{49}{27}=1.814\ldotsmean=2749=1.814…
-
The mean score is about 1.8 points.
Forgetting the frequencies
Do not just add the different scores and divide by how many rows there are. A frequency table tells you that some scores happened more often than others.
Sometimes one frequency is given as a letter, often xxx. Use the total score or total amount to form an equation.
Finding a missing frequency
A football team scored:
- 0 goals in 6 matches
- 1 goal in 8 matches
- 2 goals in xxx matches
- 3 goals in 5 matches
- 4 or more goals in 0 matches
The team scored 39 goals altogether. Find xxx.

-
Work out the known goal total.
0×6+1×8+3×5=230\times 6+1\times 8+3\times 5=230×6+1×8+3×5=23
-
The 2-goal row contributes 2x2x2x goals, so form an equation.
23+2x=3923+2x=3923+2x=39
-
Solve the equation.
2x=162x=162x=16
-
Therefore x=8x=8x=8.
Rows with frequency 0
If the frequency is 0, that row contributes nothing to the total, even if the category says something like “4 or more”.
Median and mode
- The median is the middle value when the data is in order.
- The mode is the value with the highest frequency.
A cumulative frequency is a running total of the frequencies. It helps you locate the middle value without writing out the whole list.
Median, mode and total from goals
A team played 32 matches.
Find the median, the mode, and the total number of goals.

-
Add the frequencies.
5+12+9+6=325+12+9+6=325+12+9+6=32
-
There are 32 values, so the middle positions are the 16th and 17th values.
-
Build a running total.
- Up to 0 goals: 5
- Up to 1 goal: 17
- Up to 2 goals: 26
- Up to 3 goals: 32
-
The 16th and 17th values are both in the 1-goal row, so the median is 1 goal.
-
The highest frequency is 12, so the mode is 1 goal.
-
Work out the total number of goals.
0×5+1×12+2×9+3×6=480\times 5+1\times 12+2\times 9+3\times 6=480×5+1×12+2×9+3×6=48
-
The team scored 48 goals altogether.
Choosing the middle row
The median is not always in the middle row of the table. Use the middle position and cumulative frequencies.
Grouped data gives ranges instead of exact values. For example, you might know that someone took over 20 minutes and up to 25 minutes, but not their exact time.
Class interval and midpoint
A class interval is a group or range of values. The midpoint is halfway between the lower and upper ends of the interval.
Because the exact values are unknown, the mean from grouped data is only an estimate.
Estimated mean
For grouped data, use the midpoint of each class interval:
estimated mean=total of midpoint-frequency productstotal frequency\text{estimated mean}=\frac{\text{total of midpoint-frequency products}}{\text{total frequency}}estimated mean=total frequencytotal of midpoint-frequency products
Estimating the mean time
A group of pupils completed a fitness run.
| Time interval | Frequency | Midpoint | Product |
|---|
| Over 10, up to 15 minutes | 2 | 12.5 | 25 |
| Over 15, up to 20 minutes | 6 | 17.5 | 105 |
| Over 20, up to 25 minutes | 8 | 22.5 | 180 |
| Over 25, up to 35 minutes | 4 | 30 | 120 |
Estimate the mean time.

-
Find each midpoint. For the first class:
10+152=12.5\frac{10+15}{2}=12.5210+15=12.5
-
Multiply each midpoint by its frequency. These products are shown in the final column.
-
Add the products.
25+105+180+120=43025+105+180+120=43025+105+180+120=430
-
Add the frequencies.
2+6+8+4=202+6+8+4=202+6+8+4=20
-
Divide to estimate the mean.
estimated mean=43020=21.5\text{estimated mean}=\frac{430}{20}=21.5estimated mean=20430=21.5
-
The estimated mean time is 21.5 minutes.
Unequal class widths
Do not assume every midpoint goes up by the same amount. Always find the midpoint from the two ends of the interval.
For grouped data, you can usually find the median class: the interval containing the middle value.
Finding the median class
The table shows travel times for 40 people.
| Time interval | Frequency |
|---|
| Over 0, up to 10 minutes | 5 |
| Over 10, up to 20 minutes | 9 |
| Over 20, up to 30 minutes | 11 |
| Over 30, up to 40 minutes | 10 |
| Over 40, up to 50 minutes | 5 |
Find the median class.

-
There are 40 people, so the middle positions are the 20th and 21st values.
-
Use cumulative frequencies.
- Up to 10 minutes: 5
- Up to 20 minutes: 14
- Up to 30 minutes: 25
-
The 20th and 21st values are in the “over 20, up to 30 minutes” class.
-
The median class is over 20 minutes, up to 30 minutes.
In the exam
-
Check whether the table uses exact values or grouped intervals.
-
For the mean, make a product column: value or midpoint times frequency.
-
For the median, use positions and cumulative frequencies, not just the middle row.
Check yourself
- Why is the mean from grouped data only an estimate?
- In a table with 30 values, which position or positions help you find the median?
- What two totals do you need before calculating the mean from a frequency table?