GCSE Sociology State vs Private Results: The Data
GCSE sociology state vs private results explained: what the latest school-type data shows, its limits and what students can control in their revision.
A school average can feel strangely personal. When one type of school records more top GCSE grades than another, it is easy to read the statistic as a prediction about your own future. It is not.
The clearest answer to gcse sociology state vs private results is this: official data shows a substantial private-school advantage across GCSE subjects overall, but a sociology-only comparison requires more care. Raw results describe different groups of entries; they do not prove that attending a private school caused the difference, nor do they determine the grade any individual student will achieve.
For a maths student, this is also a useful lesson in statistical reasoning. Percentages need labels. Comparisons need context. Correlation is not causation.
The short answer
Here is the essential checklist:
- Independent schools achieve higher proportions of grades 777-999 and 444-999 across GCSE subjects overall.
- The latest national headline table is not specifically a Sociology table.
- State education includes academies, free schools, comprehensives, selective schools and other centre types with very different results.
- Sociology entry patterns may differ between school types, making a simple comparison less secure.
- Raw outcomes do not control for prior attainment, pupil background, selection, subject entry policies or school location.
- A school-level percentage cannot predict an individual student's result.
That distinction matters. The data reveals an attainment gap, but it does not isolate its cause.
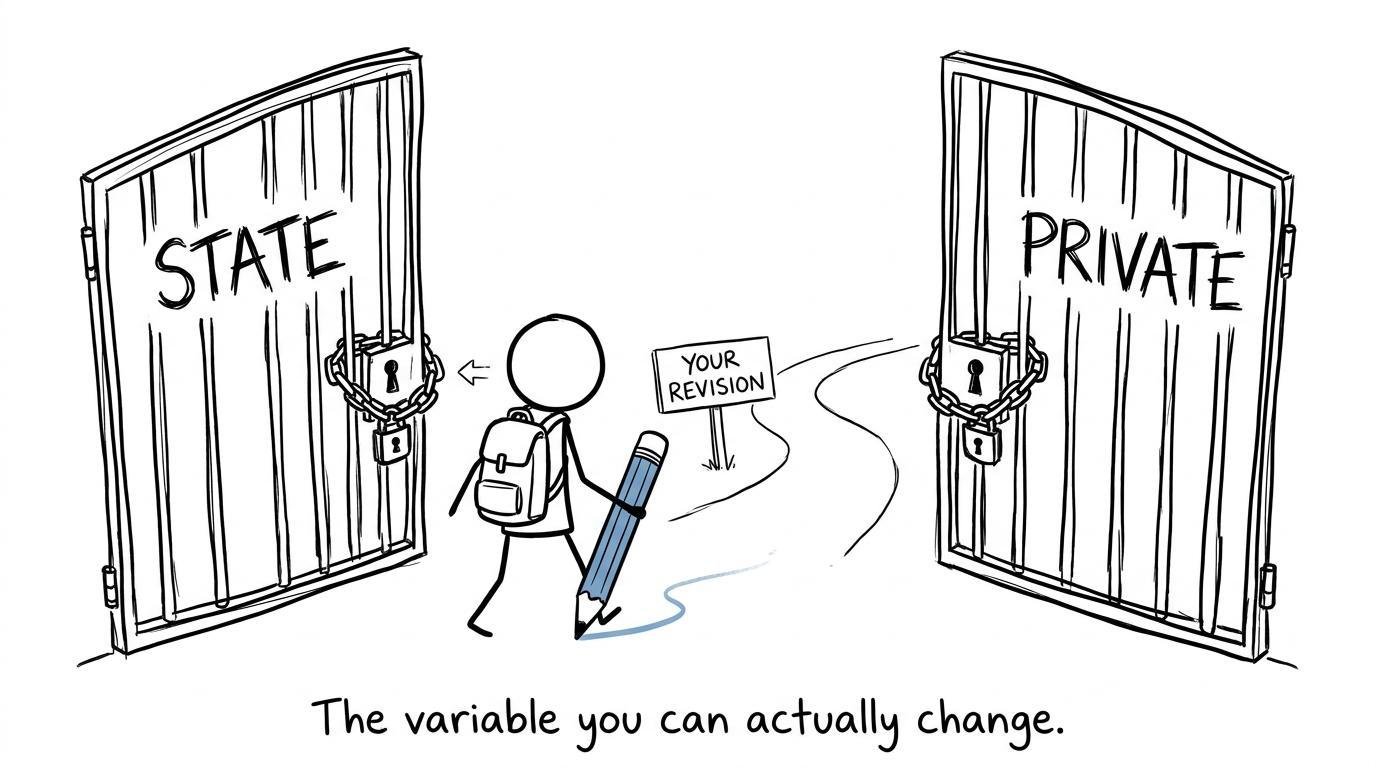 A student choosing the revision path rather than worrying about school labels
What the latest school-type results show
Ofqual's summer 2025 results for England report the following outcomes across all GCSE subjects combined. Awarding organisations classify schools and colleges using centre information, so these are centre-type comparisons rather than experiments involving otherwise identical pupils.
| Centre type | Grade 777 and above | Grade 444 and above |
|---|---|---|
| All state-funded centres | 20.7%20.7\%20.7% | 66.5%66.5\%66.5% |
| Independent schools, including CTCs | 48.1%48.1\%48.1% | 89.6%89.6\%89.6% |
| Academies | 19.5%19.5\%19.5% | 68.1%68.1\%68.1% |
| Secondary comprehensive or middle schools | 19.7%19.7\%19.7% | 68.5%68.5\%68.5% |
| Free schools | 23.7%23.7\%23.7% | 70.9%70.9\%70.9% |
| Secondary selective schools | 63.2%63.2\%63.2% | 97.4%97.4\%97.4% |
The independent versus all-state-funded difference at grade 777 and above is therefore:
48.1%−20.7%=27.4 percentage points48.1\% - 20.7\% = 27.4\text{ percentage points}48.1%−20.7%=27.4 percentage pointsAt grade 444 and above, the difference is:
89.6%−66.5%=23.1 percentage points89.6\% - 66.5\% = 23.1\text{ percentage points}89.6%−66.5%=23.1 percentage pointsThose are large descriptive gaps. Yet the table also immediately complicates the familiar state-versus-private story: state selective schools recorded a higher overall proportion of top GCSE grades than independent schools.
"State school" is not one uniform category. Combining several kinds of centre into one average can conceal substantial variation within the state sector.
Does the same gap apply specifically to GCSE Sociology?
Not automatically.
Ofqual provides an interactive GCSE centre-type dataset that can be explored by subject. The Department for Education also publishes subject entry and attainment data at national and institution level. These sources make closer analysis possible, but the widely quoted 2025 school-type figures above combine every GCSE subject.
It would be misleading to take the overall 27.427.427.4 percentage-point top-grade gap and announce that Sociology has exactly the same gap. The mix of candidates taking Sociology may not resemble the mix taking English, maths, sciences or modern languages.
Subject availability matters too. A school can only enter students for Sociology if it teaches the course. Entry policies, timetable options and cohort size may therefore shape the observed results before anyone sits an examination.
The safest conclusion is:
Private-school GCSE outcomes are considerably higher overall, but the headline figures alone do not establish the size or cause of a Sociology-specific gap.
This is why good data interpretation begins by checking the population, variable and denominator. MathsGenie's GCSE Statistics revision hub is useful if you want to strengthen precisely these skills.
Why raw GCSE Sociology comparisons can mislead
Different pupils enter different subjects
A percentage only describes the group included in its denominator:
percentage achieving a grade threshold=entries reaching the thresholdtotal entries×100\text{percentage achieving a grade threshold} = \frac{\text{entries reaching the threshold}}{\text{total entries}} \times 100percentage achieving a grade threshold=total entriesentries reaching the threshold×100If two school sectors enter different kinds of pupils for Sociology, their percentages are not like-for-like measures of teaching quality. Prior attainment, motivation, option choices and the number of entries can all differ.
A school with a very small Sociology cohort may also show large year-to-year swings. One result represents a greater proportion of a cohort of 101010 than of a cohort of 200200200.
Selection happens before the examination
Some independent schools select pupils academically; some do not. Grammar schools are state-funded but academically selective. Comprehensive schools generally serve a broader attainment range.
Selection can change the composition of a cohort before teaching, revision or examination performance is measured. A raw result cannot separate that effect from the contribution made by the school.
Background factors overlap
School type is associated with other variables, including family income, prior attainment, geography, access to quiet revision space and additional academic support. These factors may interact.
That does not mean schools have no effect. It means a simple table cannot identify how much of the gap belongs to each possible explanation. If you are revising this kind of reasoning for maths, the scatter graphs revision guide reinforces the central principle: an association between two variables does not, by itself, prove causation.
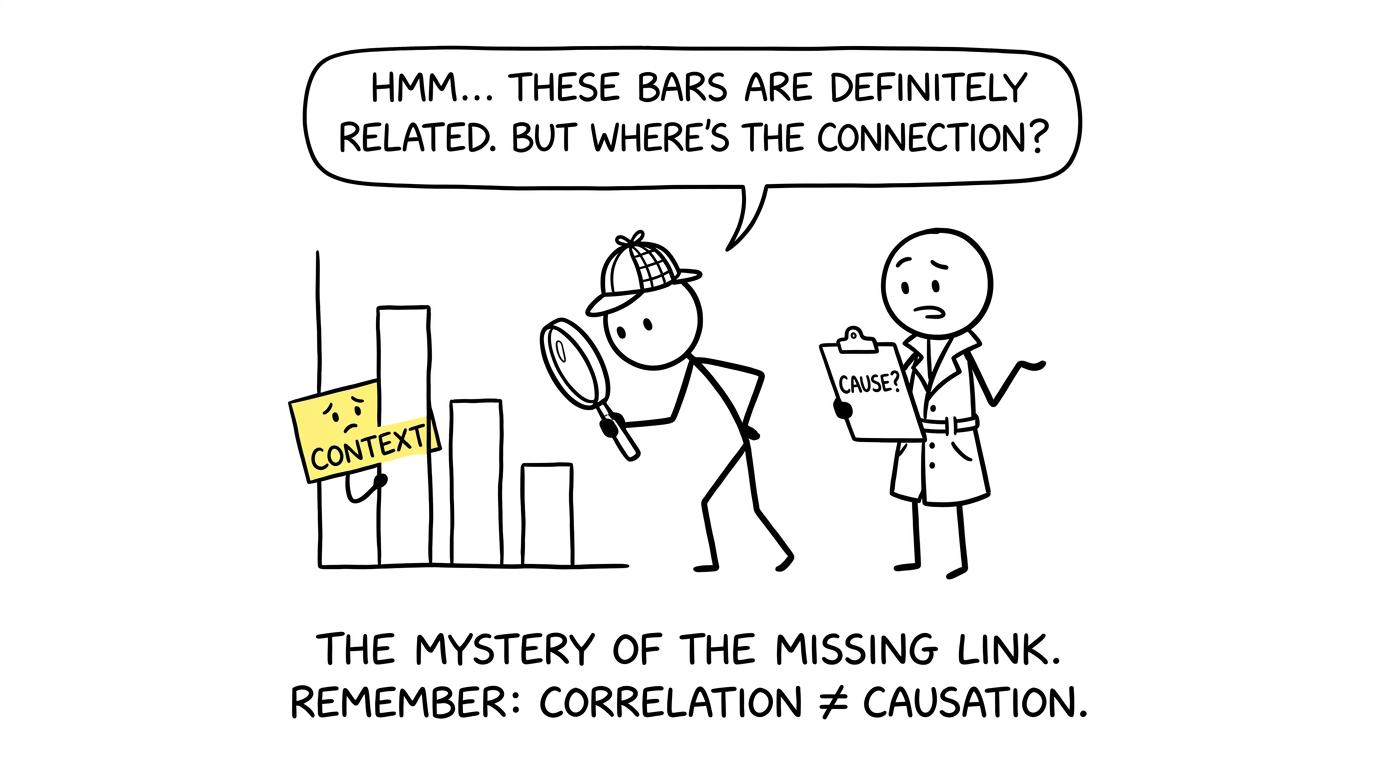 A student detective discovering that a chart has hidden its context
Grade thresholds are not average grades
The percentage achieving grade 777 or above is not the same as the average grade. Two cohorts can have the same proportion reaching grade 777 while having different distributions elsewhere.
Equally, a rise in the percentage above one threshold does not tell you what happened at every grade. A complete analysis would examine the distribution of grades, entry counts and changes over several years.
Results come from centres, not controlled trials
Ofqual's categories describe the centre where an examination was taken. Students were not randomly allocated to state and private schools. Consequently, the figures are observational.
The distinction is simple but powerful:
- Description: independent-school entries had higher overall GCSE outcomes.
- Causal claim: private schooling itself produced the entire difference.
The official results support the first statement. They do not, on their own, prove the second.
What the data does not tell an individual student
A group average is not a ceiling.
Suppose your school's top-grade rate is below the national figure. That says something about previous cohorts collectively. It does not know your current understanding, the questions you will face, how consistently you revise or how carefully you respond to a mark scheme.
The same is true if your school has exceptionally high results. A strong institutional average is not a grade already earned.
For maths revision, the productive response is to replace a broad comparison with personal evidence. Begin at the GCSE Maths revision hub, choose Edexcel, AQA, OCR or Eduqas, and work at the correct foundation or higher tier. A marked paper tells you much more about your next action than a national school-type average.
How maths students should read education statistics
Education data offers excellent practice in GCSE statistical literacy. Before accepting a claim, ask:
- Is the figure for Sociology or for every GCSE combined?
- Is it based on pupils, entries, schools or examination centres?
- Does "state" include selective schools?
- Is the comparison a percentage or a percentage-point difference?
- Are the cohort sizes similar?
- Has the analysis controlled for prior differences?
- Is the claim descriptive or causal?
The difference between a percentage change and a percentage-point change is particularly important. Moving from 20%20\%20% to 30%30\%30% is an increase of 101010 percentage points, but the relative percentage increase is:
30−2020×100=50%\frac{30-20}{20}\times 100 = 50\%2030−20×100=50%News coverage sometimes blurs these measures. The GCSE Maths topics by exam board and tier guide can help you identify where percentages, sampling, averages and data interpretation sit within your own specification.
Common mistakes when comparing school results
Treating all state schools as identical
The 2025 figures range widely across state-funded centre types. Selective and non-selective schools should not be silently merged when the distinction affects the question being asked.
Using all-subject figures as Sociology figures
An overall GCSE statistic gives context, not a subject-specific answer. Check the subject filter and entry base before drawing a Sociology conclusion.
Confusing percentage points with percentages
A gap from 20.7%20.7\%20.7% to 48.1%48.1\%48.1% is 27.427.427.4 percentage points. Calling it simply a 27.4%27.4\%27.4% increase changes the meaning.
Assuming correlation proves causation
A relationship can be real without revealing its cause. School selection, pupil characteristics, location and subject-entry practices may all contribute.
Believing an average predicts your grade
Statistics summarise groups. Your result depends on the marks you secure. Use the one-month GCSE maths revision plan to turn that principle into scheduled action.
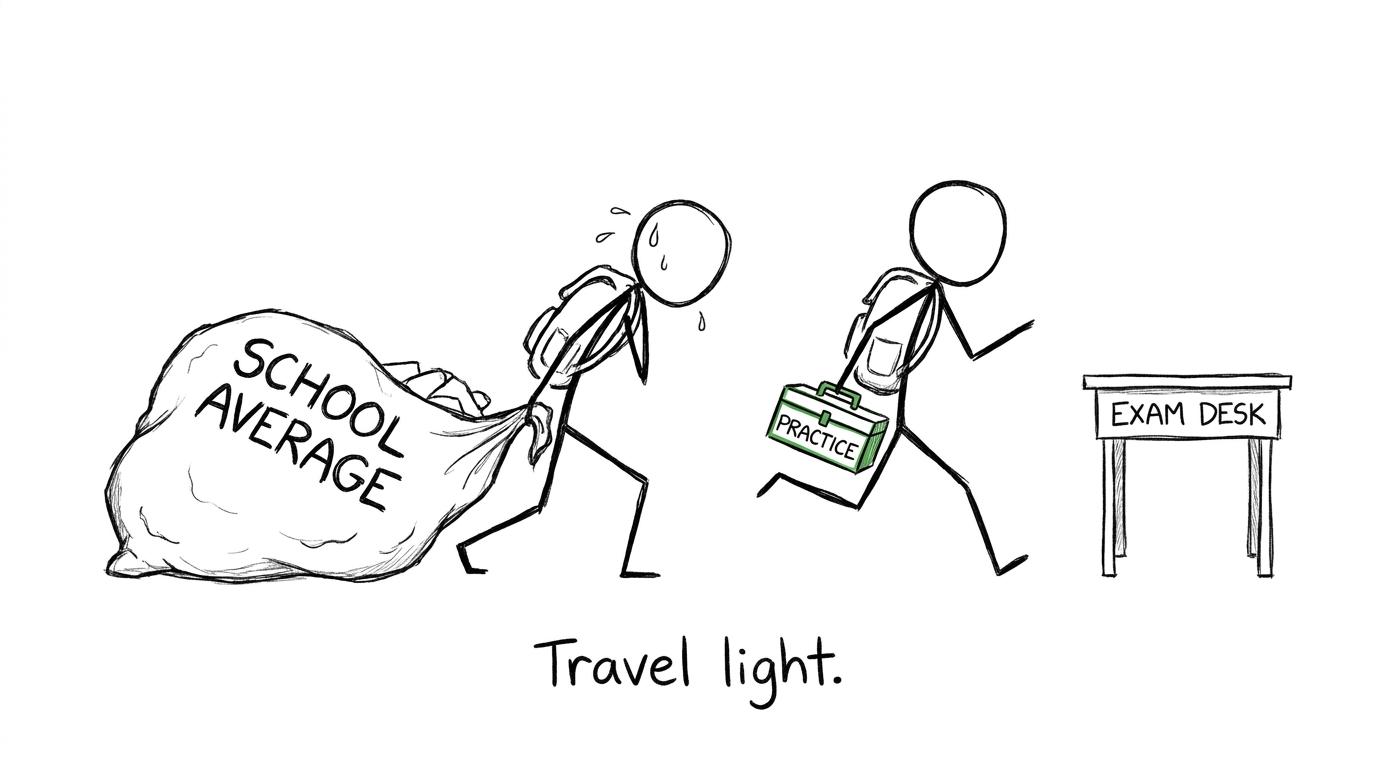 One student carrying a school average while another carries a practical revision toolkit
Turn comparison into useful evidence
The most valuable dataset during revision is your own error log.
Complete a short timed set, mark it honestly and classify every lost mark. Was it missing knowledge, an incorrect method, weak algebra, calculator input, poor interpretation or time pressure? Then revisit the exact topic rather than vaguely deciding to "do more maths".
MathsGenie's averages from frequency tables guide helps with interpreting grouped results, while the probability revision guide develops careful thinking about expected outcomes and uncertainty. For broader planning, use the GCSE maths revision timetable to combine topic work with timed practice.
The conclusion that matters
State and private GCSE results do differ considerably overall. The official 2025 figures show a clear attainment gap, including at grades 777-999. But those headline numbers do not prove that school type alone caused the gap, and they should not be presented as an exact GCSE Sociology comparison without examining subject-level entries and outcomes.
Most importantly, they do not forecast your result.
Start with MathsGenie's free revision lessons and practice questions. Check your work against solutions and mark schemes, use mini tests to find weak areas, then build towards past papers and predicted papers under timed conditions. National statistics can describe the landscape. Consistent, well-marked practice is how you move through it.