GCSE History Gender Gap Results: What Data Shows
GCSE history gender gap results explained through 2025 national data, with careful interpretation and practical revision advice for GCSE students today.
A national result can feel oddly personal. You see that one group achieved more top grades than another, then wonder whether the pattern says something about your own prospects. The latest GCSE history gender gap results do show a measurable difference: in England in 202520252025, female entries were more likely than male entries to achieve both grade 444 and above and grade 777 and above in History.
But that is a description of thousands of entries, not a prediction for one student. National figures can reveal patterns. They cannot measure your next month of revision, the quality of your feedback or what happens when you finally fix the questions that keep costing you marks.
For maths students, there is another reason to look carefully: this is statistical interpretation in the real world. Percentages, percentage-point differences, populations and correlation all matter.
The answer at a glance
- In England in 202520252025, female GCSE History entries achieved higher outcomes than male entries at key grade thresholds.
- At grade 777 and above, the difference was about 7.47.47.4 percentage points.
- At grade 444 and above, the difference was about 6.06.06.0 percentage points.
- Both gaps were slightly narrower than in 202420242024.
- The figures describe entries, not the fixed ability of individual boys or girls.
- The data does not, by itself, explain what caused the differences.
- Your useful response is individual: diagnose weak skills, practise deliberately and act on feedback.
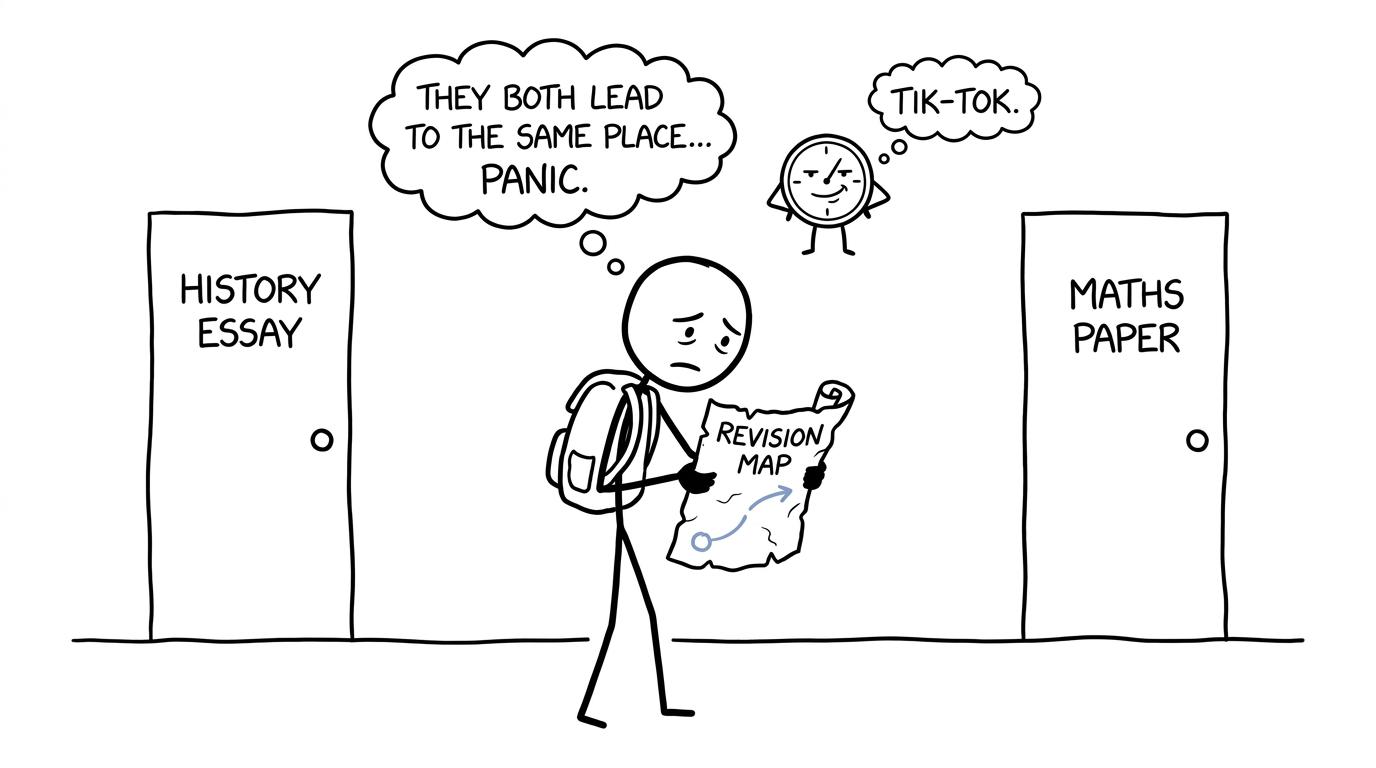 A student choosing between History and maths revision while a clock looks smug
What the 2025 national GCSE History data shows
The latest complete subject-level data comes from the Joint Council for Qualifications, or JCQ. Its 202520252025 table reports GCSE full-course History outcomes by sex for England. JCQ now uses the label sex rather than gender, aligning its presentation with the Department for Education and Ofqual. The search phrase commonly uses “gender gap”, so both terms appear here, but they are not automatically interchangeable.
The key figures are:
| Entries in England | Number of entries | Grade 777 and above | Grade 444 and above |
|---|---|---|---|
| Male | 142,594142,594142,594 | 22.4%22.4\%22.4% | 61.1%61.1\%61.1% |
| Female | 146,670146,670146,670 | 29.8%29.8\%29.8% | 67.2%67.2\%67.2% |
| All entries | 289,264289,264289,264 | 26.2%26.2\%26.2% | 64.2%64.2\%64.2% |
Figures are rounded to one decimal place. At the higher-grade threshold, female entries were approximately 7.47.47.4 percentage points ahead. At grade 444 and above, the difference was approximately 6.06.06.0 percentage points.
A percentage-point gap is calculated as:
gap=female outcome rate−male outcome rate\text{gap}=\text{female outcome rate}-\text{male outcome rate}gap=female outcome rate−male outcome rate“Percentage points” is the correct language when subtracting two percentages. Saying the grade 777 gap was 7.4%7.4\%7.4% would risk implying a relative percentage change, which is a different calculation.
These figures answer the central question clearly: yes, there is a gender gap in national GCSE History outcomes, with female entries achieving higher results at the main thresholds in 202520252025.
Is the History gap getting wider or narrower?
A single year is a snapshot. Looking at the previous year provides some context.
| Threshold | 202420242024 gap | 202520252025 gap | Direction |
|---|---|---|---|
| Grade 777 and above | About 7.97.97.9 percentage points | About 7.47.47.4 percentage points | Narrower |
| Grade 444 and above | About 6.46.46.4 percentage points | About 6.06.06.0 percentage points | Narrower |
The narrowing is modest. It would be misleading to describe it as the gap disappearing, but it would also be wrong to say that the difference grew in 202520252025.
The broader GCSE picture points in a similar direction. For 161616-year-olds across all subjects in England, Ofqual reported that 73.6%73.6\%73.6% of female entries and 67.5%67.5\%67.5% of male entries achieved grade 444 or above in 202520252025. At grade 777 and above, the respective figures were 25.5%25.5\%25.5% and 20.5%20.5\%20.5%. Ofqual said the overall gap had narrowed again.
Those overall figures use a different population from the JCQ History table, so they should not be merged into one calculation. They provide context, not a direct like-for-like comparison.
What the results do not tell us
This is where careful interpretation matters most. National tables show an association between recorded sex and outcomes. They do not prove that sex caused those outcomes.
The published headline data does not isolate every relevant factor, such as:
- prior attainment;
- attendance and disruption to learning;
- school and regional context;
- disadvantage and access to resources;
- subject-entry patterns;
- confidence with extended writing;
- the amount and quality of revision completed.
Ofqual conducts separate equalities analyses that control for several student characteristics, because raw group comparisons cannot answer causal questions on their own. Even sophisticated modelling needs cautious interpretation.
Nor can the table tell us that every girl outperformed every boy. The distributions overlap. Many male students achieved the highest grades, while many female students did not reach the headline thresholds. An average difference between groups leaves enormous variation within each group.
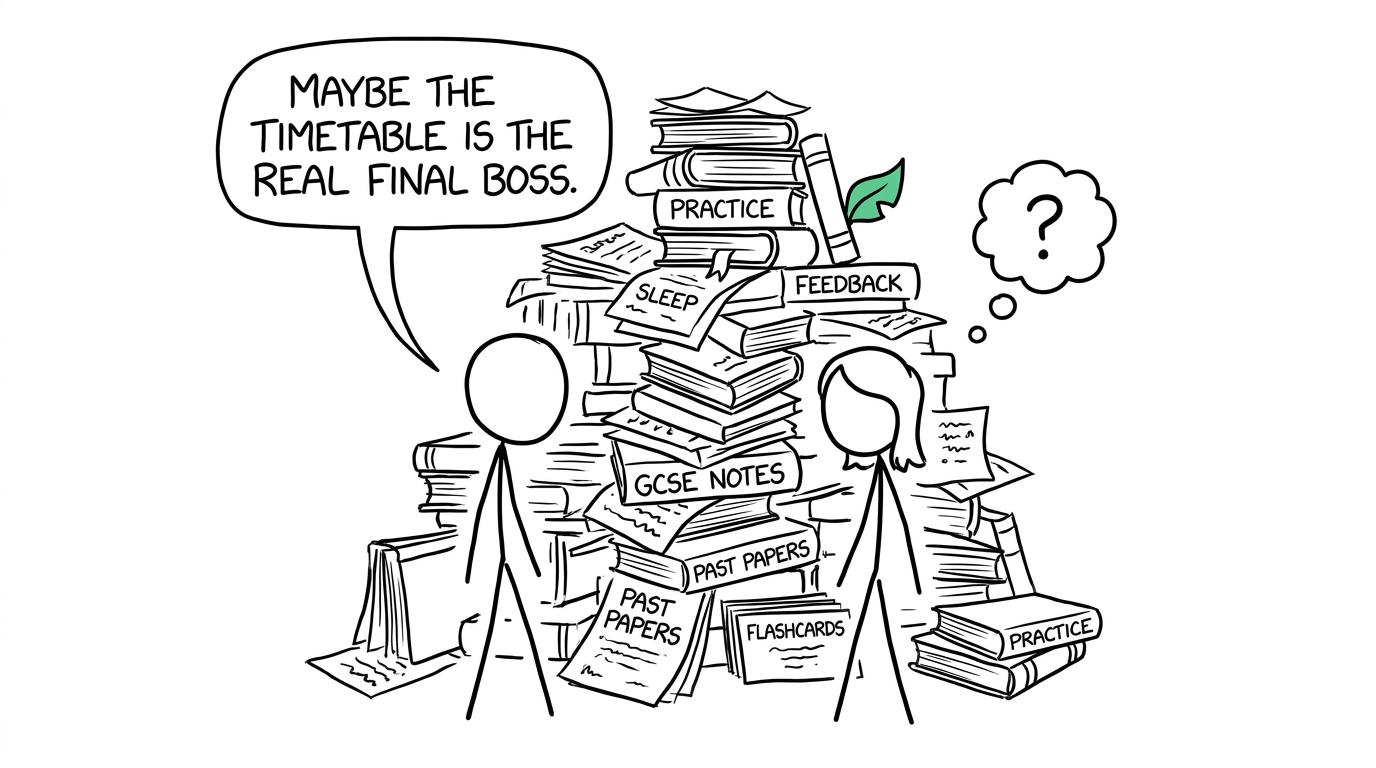 Students discover that the revision timetable may be the real final boss
Why this matters to a GCSE maths student
At first glance, GCSE History data may seem remote from simultaneous equations or circle theorems. Yet the habits needed to read it are mathematical.
Check the population
Ask whether the data covers England, the whole UK, all ages or only 161616-year-olds. A statistic can be accurate and still be used badly if its population is changed halfway through an argument.
Distinguish entries from students
Exam-results tables commonly count subject entries or results. They do not necessarily count unique pupils. One student can contribute results in several subjects to an all-subject total.
Separate percentage points from percentage change
A movement from 20%20\%20% to 25%25\%25% is an increase of 555 percentage points. Relative to the original value, it is a 25%25\%25% increase. Those statements answer different questions.
Avoid turning correlation into causation
Two variables moving together does not establish that one caused the other. This principle appears throughout GCSE Statistics and becomes even more important at A Level.
Students who want to strengthen these skills can use the free GCSE Maths revision hub, where topics are connected to revision lessons, exam questions, short tests and solutions.
Do exam boards show the same pattern?
The national JCQ data combines results from its member awarding organisations rather than presenting one Edexcel, AQA, OCR or Eduqas specification as the explanation for the overall pattern.
Specifications differ in content combinations and paper structures, but regulated GCSEs are designed against national subject requirements. You should therefore revise the exact course taught by your school rather than assuming that a national trend identifies a particular paper, topic or exam board as the cause.
Check your specification, assessment objectives and teacher guidance. In History, that means knowing the required knowledge, source or interpretation demands and expectations for extended responses. In maths, it means matching practice to your board and foundation or higher tier. The MathsGenie revision planner can help turn that broad workload into a manageable sequence.
What students should do with the data
The healthiest conclusion is neither “the gap does not matter” nor “the gap decides my grade”. Group differences matter to schools and policymakers because persistent patterns deserve investigation. For an individual candidate, however, the next action must be based on individual evidence.
Use a simple revision loop:
- complete a timed question set or paper section;
- mark it against the mark scheme;
- record why each mark was lost;
- revise the smallest relevant skill;
- attempt a fresh question later;
- compare the new evidence with the old.
For maths, find your weakest topics from exam evidence rather than choosing revision according to a national average. If time is limited, the 20-minute maths revision routine keeps the cycle small enough to repeat.
A useful timetable should also leave room for every subject. The aim is not to revise History at the expense of maths, or the reverse. Use the GCSE maths revision timetable guide to organise short topic sessions alongside essay-based subjects.
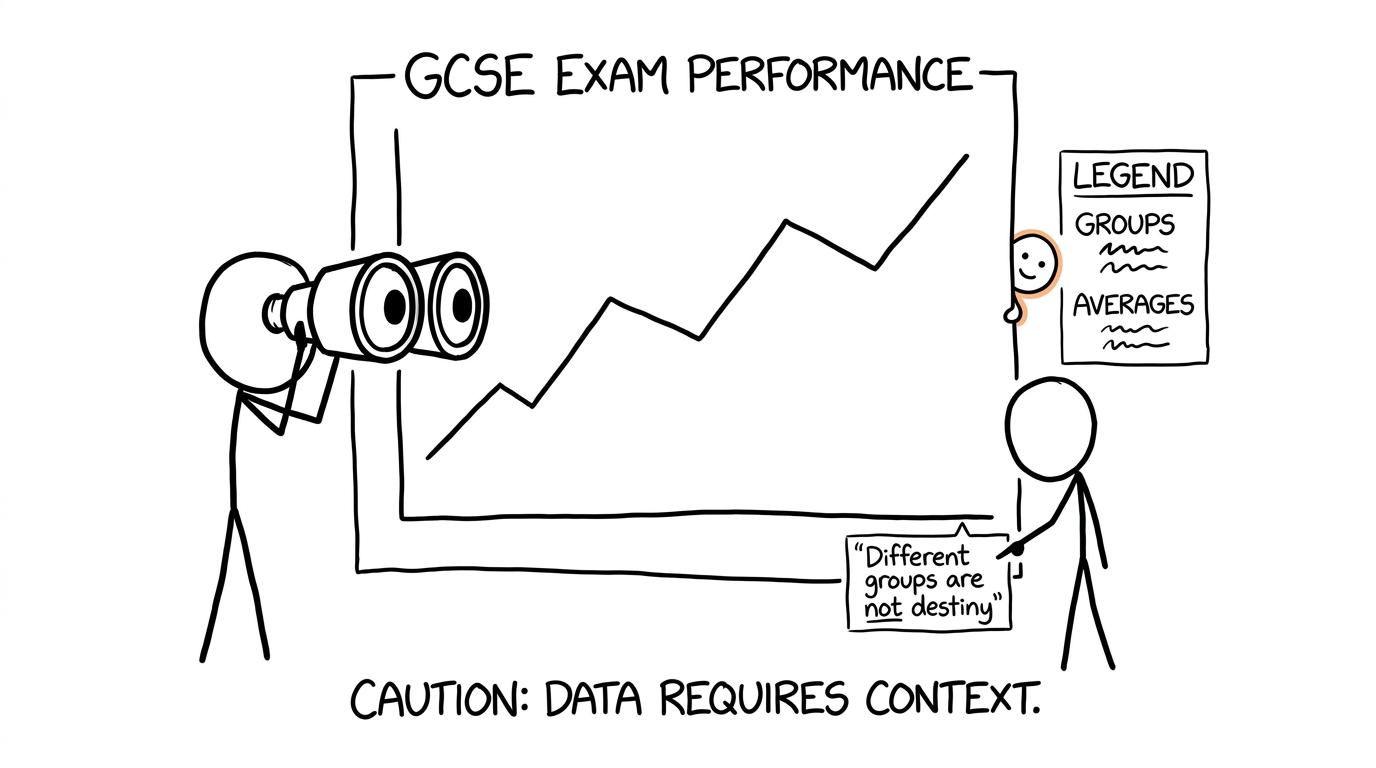 A student uses binoculars to inspect the important footnote beneath a giant chart
Common mistakes when reading gender-gap results
Treating an average as a personal forecast
A national difference cannot tell you the grade you will receive. Your completed work, feedback and exam performance are more relevant to your personal revision decisions.
Saying girls are “better at History”
The data shows higher female outcome rates in a particular assessment series. It does not establish an innate difference in ability, nor does it explain the cause.
Confusing the number of entries with success rates
Female students accounted for slightly more History results in England in 202520252025, but entry share and grade rate are separate measures. More entries do not mathematically guarantee a higher percentage reaching a threshold.
Comparing incompatible datasets
Do not place an England-only figure beside a UK figure, or an all-age figure beside a 161616-year-old figure, without stating the difference. Check year, geography, qualification, age group and threshold first.
Ignoring rounding
Published percentages may be rounded. A gap calculated from displayed one-decimal figures can differ slightly from a calculation using the underlying data.
Using predicted papers as predictions of personal ability
A predicted paper is practice designed around likely styles and content, not a forecast of your result. Use Edexcel GCSE Maths predicted papers alongside official past papers, topic work and mark schemes. The guide on when to start GCSE past papers explains how to build towards timed practice without rushing.
The result that still belongs to you
The national GCSE History gender gap is real in the latest published results. Female entries in England had higher rates at grade 444 and grade 777 thresholds in 202520252025, although both differences narrowed slightly from 202420242024.
That finding deserves careful attention, not a stereotype. Data is most useful when it improves the next decision. It should encourage schools to ask better questions and students to resist fatalistic answers.
Your grade is earned one corrected mistake at a time. Start at the MathsGenie GCSE Maths revision hub, choose your board and tier, then combine free revision lessons and practice questions with mini tests, past papers, predicted papers, mark schemes and video solutions. National statistics describe where groups have been. Your revision determines what you do next.