GCSE Arabic State vs Private Results: What Data Shows
GCSE Arabic state vs private results explained: see what official 2025 data reveals, why raw grade gaps can mislead and what students should focus on.
A results table can make school type look like destiny. One column says state, another says private, and the percentages seem to settle the argument before anyone asks who entered the exam.
The short answer on GCSE Arabic state vs private results is more cautious: raw outcomes can differ across centre types, sometimes substantially, but the available figures do not prove that attending a private school causes a higher Arabic grade. Cohort background, prior fluency, entry policy, tier choice and the number of candidates can all affect the comparison.
For students preparing for GCSE maths, this matters beyond Arabic. It is a lesson in reading statistics properly, separating what a dataset measures from the story we are tempted to attach to it.
The answer at a glance
Before drawing conclusions from GCSE Arabic results, check five things:
- whether the figures are for Arabic specifically or all GCSE subjects combined;
- whether they describe state-funded schools, independent schools or more detailed centre categories;
- whether the percentages are cumulative, such as grade 777 and above;
- how many candidates and centres sit behind each percentage;
- whether the data controls for prior attainment, home-language experience or pupil background.
The latest official sources provide useful descriptive data. They do not offer a controlled experiment comparing otherwise identical pupils in different schools.
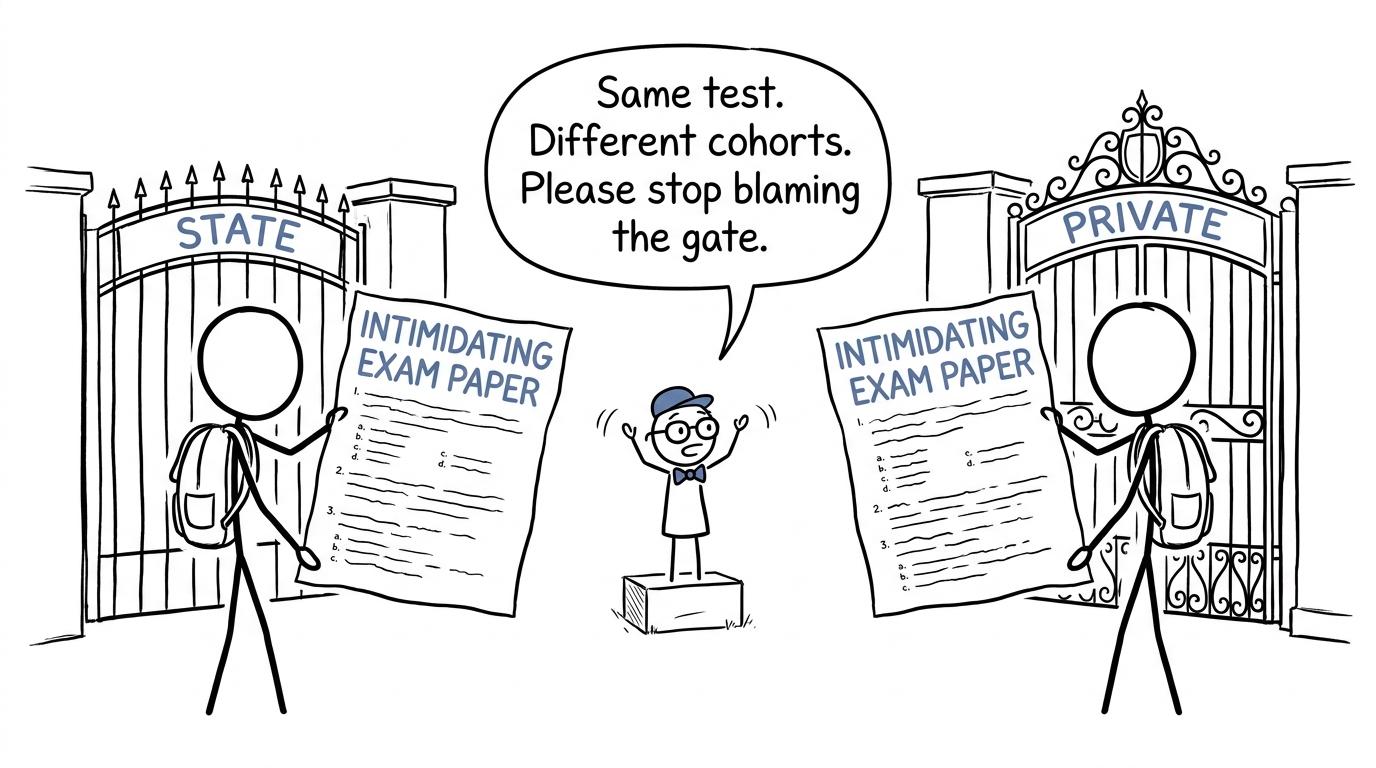 Two students at different school gates face the same examination while a statistician warns about comparing cohorts
What the latest GCSE Arabic data shows
Pearson's final June 202520252025 grade statistics record 5,3255,3255,325 candidates for GCSE Arabic. Of these results, 29.2%29.2\%29.2% were at grade 999, 58.5%58.5\%58.5% were at grade 777 or above, and 84.7%84.7\%84.7% were at grade 444 or above.
The corresponding final figures for June 202420242024 were 5,2575,2575,257 candidates, with 59.6%59.6\%59.6% achieving grade 777 or above and 84.4%84.4\%84.4% achieving grade 444 or above.
These totals suggest that overall Arabic outcomes were relatively stable across those two examination series. The grade 777 and above rate changed by −1.1-1.1−1.1 percentage points, while the grade 444 and above rate changed by 0.30.30.3 percentage points.
That is useful information, but it is not a state-versus-private comparison. Pearson's published subject statistics combine candidates rather than separating the figures by school sector.
Ofqual's GCSE centre-type visualisation provides the relevant second layer. It allows users to select individual subjects, including Arabic, and examine cumulative outcomes at thresholds such as grade 777 and above or grade 444 and above. Its latest published series covers results through summer 202520252025.
The important word is centre. Results are classified using the type recorded for the examination centre. Ofqual explains that these categories are based on the National Centre Number register and are reported by centres. A centre category describes where an entry was recorded; it does not capture every detail of how, where or for how long a candidate learned Arabic.
The wider private-school gap is real but not Arabic-specific
Across all GCSE subjects in England in summer 202520252025, official Ofqual statistics reported that 48.1%48.1\%48.1% of results from independent schools were at grade 777 or above, compared with 20.7%20.7\%20.7% across all state-funded centres. At grade 444 or above, the corresponding figures were 89.6%89.6\%89.6% and 66.5%66.5\%66.5%.
Those are differences of 27.427.427.4 and 23.123.123.1 percentage points respectively. They are large raw gaps.
But they cover all subjects combined. They cannot be presented as the GCSE Arabic gap. Combining the overall centre-type table with the overall Arabic grade distribution would mix two different datasets and create a statistic that neither source actually reports.
This is one of the most transferable ideas in GCSE statistics: two true figures do not automatically form a valid comparison.
Why Arabic cohorts may be unusually difficult to compare
GCSE Arabic is not necessarily taken by similar groups of pupils in every school. Several sources of selection may shape the results.
Prior exposure to Arabic
Some candidates may have used Arabic at home, attended supplementary classes or studied it for years before beginning the GCSE course. Others may be learning it principally through school. Published grade totals do not routinely separate those experiences.
That does not make either candidate's achievement less valuable. It simply means that school type alone may be a poor explanation of the resulting grade distribution.
Whether a school offers Arabic
Arabic is less widely offered than subjects such as French or Spanish. Some schools teach a full timetabled course, while others may enter a small number of pupils who already have substantial language knowledge. Availability can vary between state and independent sectors and between regions.
Consequently, the pupils who reach the examination may be highly selected rather than representative of everyone attending that type of school.
Small cohorts
A percentage can look precise even when it rests on few candidates. If a centre enters 101010 pupils, one result changes its grade-threshold rate by 101010 percentage points.
That is why the number of results and centres matters alongside the percentage. A large swing in a small group may reflect only a handful of grades.
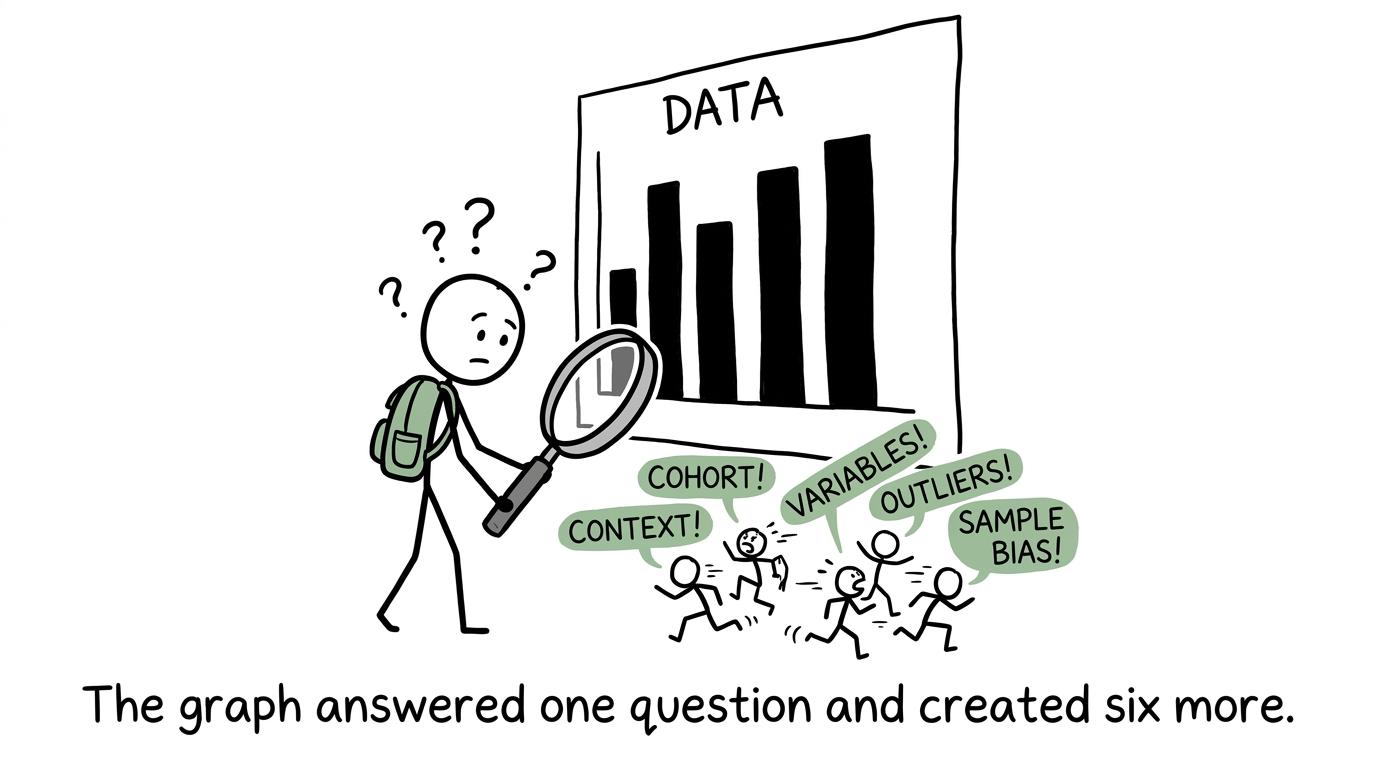 A student studies a bar chart while the missing context escapes from the graph
Tier of entry
The Pearson Edexcel GCSE Arabic qualification has Foundation and Higher tiers. Candidates must be entered for the same tier across all four papers. Foundation targets grades 111 to 555, while Higher targets grades 444 to 999.
If the balance of Foundation and Higher entries differs across school types, the final grade distributions will also differ. A sector with a larger proportion of Higher-tier candidates has access to grades above 555, but that fact alone does not show better teaching.
Different candidate profiles
Prior attainment, age, region, additional tuition and the way schools decide who should enter can all influence outcomes. A raw centre-type comparison does not hold these factors constant.
In statistical language, school sector is associated with many other variables. An association between sector and grades is not automatically a causal effect.
What the data does not tell you
The official results do not answer several questions students and parents may understandably ask:
- how much progress candidates made from their individual starting points;
- whether candidates regularly used Arabic before beginning the course;
- how many hours of classroom or external tuition they received;
- whether otherwise similar pupils would earn different grades after changing school sector;
- whether a particular state or private school is stronger than another school nearby.
Nor should national percentages be used to predict an individual's grade. A cohort average is a description of a group, not a ceiling placed over one student.
The same principle applies when comparing maths outcomes across Edexcel, AQA, OCR and Eduqas. Your board, tier, preparation and performance matter more to your next answer than a national average. MathsGenie's GCSE maths topics by exam board and tier can help you identify exactly what applies to your paper.
How to read GCSE results comparisons well
A reliable interpretation starts with the denominator: who is included?
If a chart reports grade 777 and above, the percentage is conceptually:
number of results at grades 7,8 or 9total number of results in the group×100%.\frac{\text{number of results at grades }7,8\text{ or }9}{\text{total number of results in the group}} \times 100\%.total number of results in the groupnumber of results at grades 7,8 or 9×100%.Next, distinguish a percentage-point difference from a percentage change. If two groups have rates a%a\%a% and b%b\%b%, their percentage-point gap is:
∣a−b∣.|a-b|.∣a−b∣.Then inspect the year, qualification, subject and geographical coverage. GCSE Arabic, International GCSE Arabic and Arabic First Language qualifications are not interchangeable datasets.
Finally, ask whether the comparison is descriptive or causal. “Group A had a higher percentage” is descriptive. “School type caused the higher percentage” is causal and requires much stronger evidence.
These skills appear throughout GCSE maths statistics. You can strengthen them through the free GCSE Maths revision hub, where revision lessons and practice questions connect statistical ideas to exam-style tasks.
What students should do with this information
Interesting data should lead to better decisions, not unnecessary anxiety. Your school category is fixed in the short term; your revision process is not.
Start by confirming your maths exam board and tier. Then use a short assessment or paper to generate evidence about your own performance. MathsGenie's past paper library brings together papers and official mark schemes, while the AQA GCSE Maths past papers page is a useful board-specific starting point.
After marking, sort each lost mark into one of three categories:
- a topic or knowledge gap;
- an inaccurate method or calculation;
- a misunderstanding of the question.
Repair the largest pattern first. The guide to using GCSE past papers properly explains how to move from a score to an error log, targeted revision and retesting. If your notes feel familiar but disappear under exam pressure, use the active recall approach for GCSE maths.
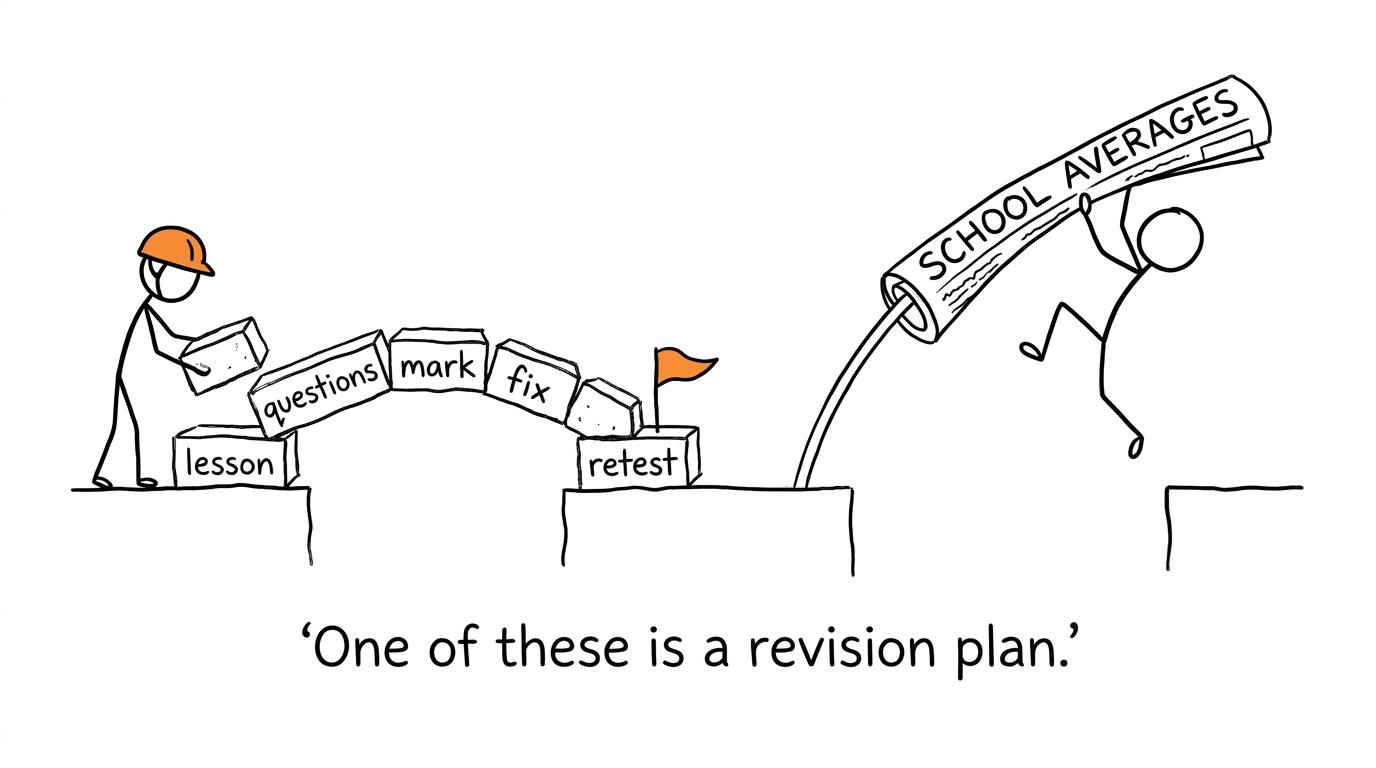 A student builds a revision bridge while another tries to jump across using school averages
Common mistakes when interpreting school results
Treating all GCSE data as subject-specific
An all-subject state-versus-independent figure cannot be labelled as an Arabic result. Always verify the selected subject and threshold.
Confusing percentage points with percentages
A change from 40%40\%40% to 50%50\%50% is an increase of 101010 percentage points, not 10%10\%10%. The relative increase is 25%25\%25%.
Ignoring entry patterns
Schools may differ in who they enter, which tier candidates take and whether Arabic is taught as a normal curriculum subject. These differences can influence the outcome before teaching quality is considered.
Assuming correlation proves causation
A higher raw result does not isolate the effect of school type. Selection, prior attainment and language experience may be involved.
Letting averages determine expectations
National results cannot tell you the grade you will receive. Your most useful evidence is your performance on correctly matched exam questions, mini tests and timed papers.
Turn comparison into preparation
The fairest conclusion is not that state and private GCSE Arabic outcomes are identical, nor that one school sector automatically produces better Arabic grades. Official data can reveal raw differences, but it does not provide a like-for-like estimate of the effect of school type.
Read the cohort before reading the conclusion. Check the subject, denominator, tier and candidate profile. Then return to the evidence you can act on.
For maths, begin with MathsGenie's free GCSE revision resources. Use revision lessons and practice questions to rebuild weak topics, mini tests to check recall, and past papers with mark schemes and video solutions to improve exam technique. As the examination approaches, add predicted papers and follow a calm GCSE maths exam-week checklist.
School averages describe where groups have been. Focused practice helps decide where you go next.