Learning Styles GCSE Statistics: What Works?
Learning styles GCSE statistics: see what evidence says about visual, auditory and kinaesthetic revision, and build a practice-led plan that earns marks.
Revision can become strangely personal. One student colours every graph. Another listens to explanations. Someone else insists they can only learn by doing. It is easy to conclude that success depends on discovering the right label.
But the evidence on learning styles GCSE statistics revision gives a more useful answer: matching revision to a fixed visual, auditory or kinaesthetic style has not been shown reliably to improve learning. Preferences are real, but they are not instructions for how your brain must learn. For GCSE Statistics, the stronger approach is to choose a method that fits the task, practise retrieving and applying knowledge, check your answers and return to weak topics later.
That may sound less exciting than discovering your personal learning type. It is also more liberating. You do not need a label before you can improve.
The short answer: do learning styles matter?
Not in the way they are often advertised.
The traditional learning-styles claim says that a visual learner should receive visual instruction, an auditory learner should listen, and a kinaesthetic learner should learn through movement or physical activity. This is sometimes called the matching or meshing hypothesis.
Research has not established that matching teaching to these supposed fixed types produces a reliable improvement in attainment. A 2024 meta-analysis found a small overall benefit across the studies it examined, but genuine matching effects appeared infrequently, study quality was low and the authors concluded that the evidence did not justify widespread adoption. Other systematic reviews have similarly found no dependable support for sorting learners into sensory categories.
The Education Endowment Foundation also describes the evidence for using learning styles in schools as extremely limited. It warns that restricting pupils to activities based on a reported preference may be unhelpful.
This does not mean diagrams, videos or spoken explanations are useless. It means their usefulness depends more on the content and the learning goal than on whether you have called yourself a visual or auditory learner.
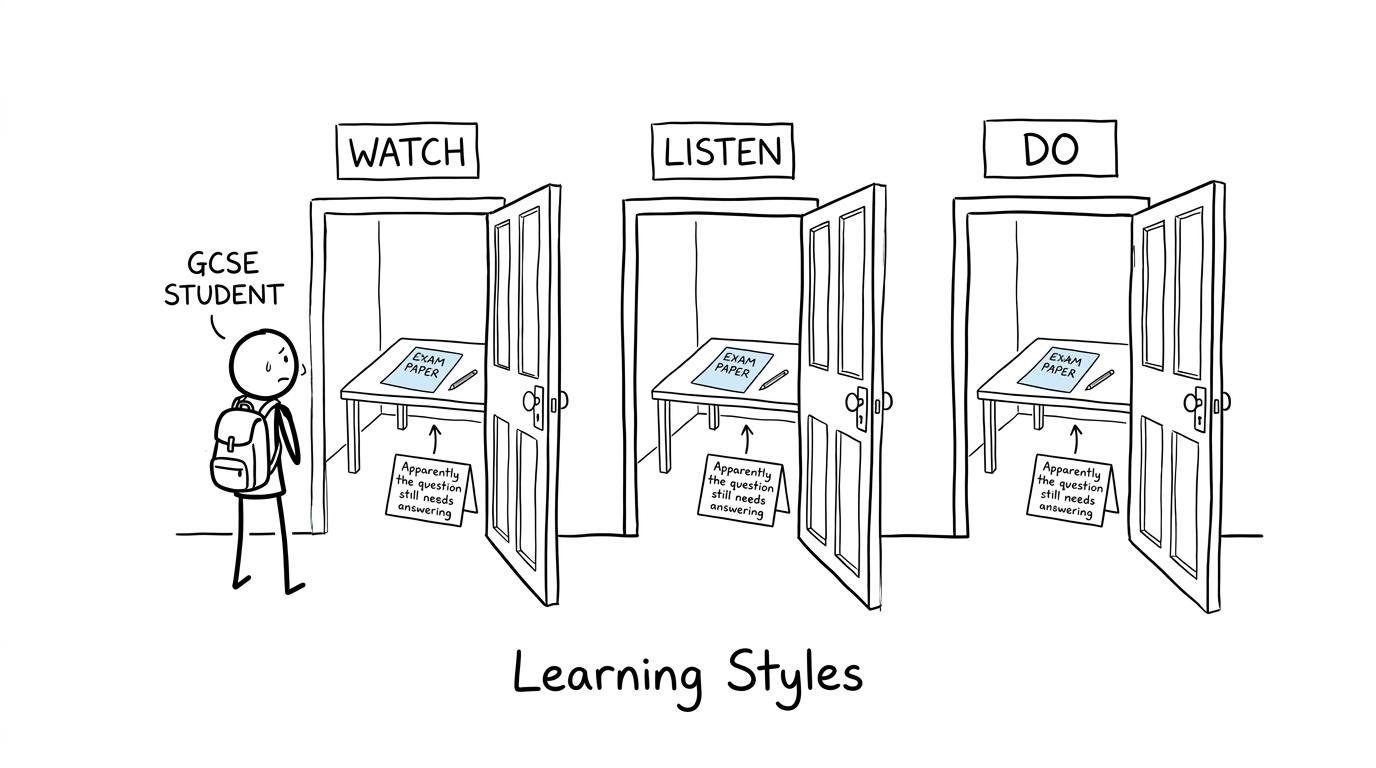 A student discovers that every learning-style door leads to practice
A better GCSE Statistics revision checklist
Use this checklist instead of a learning-style quiz:
- Identify the exact statistical skill you need to improve.
- Learn the idea using a clear explanation and an appropriate representation.
- Close your notes and recall the method or key definitions.
- Answer exam-style questions without support.
- Check your work against the solution or mark scheme.
- Record why each mark was lost.
- Reattempt the topic after a gap.
- Test it later among mixed questions or in a past paper.
You can find board-specific resources in the GCSE Statistics revision hub or use the wider GCSE Maths revision area if statistics is one strand of your GCSE Maths course.
Match the revision method to the statistical task
There is an important difference between matching a method to a learner and matching it to the material.
A graph is often appropriate for understanding a distribution because the shape, centre and spread matter. Spoken explanation may help when you are learning how to justify whether a sample is biased. Written exam practice is essential because the examination requires you to read, calculate, interpret and communicate on paper.
That is not learning-styles theory. It is sensible task design.
Use visual representations when the topic is visual
GCSE Statistics includes tables, charts, cumulative frequency graphs, box plots, histograms and scatter graphs. Looking carefully at accurate representations can make relationships visible, but simply looking is not enough.
Ask yourself questions such as:
- What does each axis represent?
- Is the scale uniform?
- What feature shows centre or spread?
- Which conclusion is supported by the data?
- What information has been hidden by the summary?
For example, a box plot communicates the median and spread, while a histogram uses bar area to represent frequency. The essential histogram relationship is
frequency density=frequencyclass width.\text{frequency density}=\frac{\text{frequency}}{\text{class width}}.frequency density=class widthfrequency.A visual preference will not remove the need to understand that relationship. Use the histograms revision resources to combine diagrams with questions, rather than treating the diagrams as decoration.
Use explanation when language carries the marks
Statistics questions often ask you to interpret, compare, criticise or evaluate. These are language-heavy tasks, even when a graph is provided.
Explaining an answer aloud can expose vague thinking. Can you explain why correlation does not establish causation? Can you describe why an extrapolation may be unreliable? Can you compare two distributions using both a measure of centre and a measure of spread?
Speaking is useful here because it forces you to organise the argument. However, the final step should still be written practice. An examiner can only award marks for what appears in your answer.
The scatter graphs revision guide is a useful place to practise the language of correlation, lines of best fit and estimation.
Use active calculation when fluency matters
Some statistical knowledge becomes secure only when you use it. Watching somebody calculate an estimated mean can feel clear because every decision has already been made for you. Starting an unfamiliar question yourself is harder. That difficulty is valuable because it reveals whether you can select the method independently.
For a frequency table, the structure may involve
mean=total of value-frequency productstotal frequency.\text{mean}=\frac{\text{total of value-frequency products}}{\text{total frequency}}.mean=total frequencytotal of value-frequency products.For grouped data, class midpoints are used, so the result is an estimate. You need to recognise which version applies, construct the necessary working and interpret the answer in context. The averages from frequency tables guide supports that progression from explanation to independent practice.
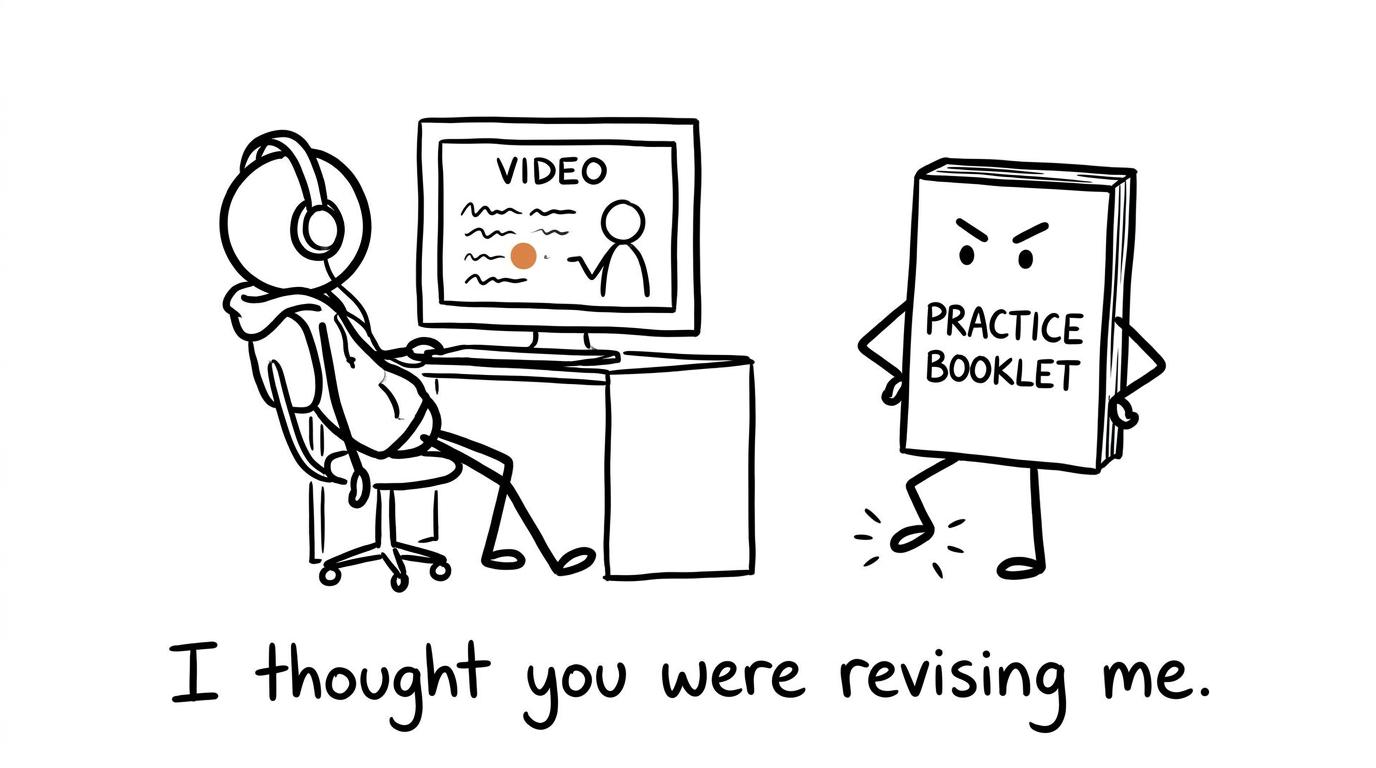 An unopened question booklet waits for active revision
What the evidence supports instead
Rejecting fixed learning styles does not mean every revision method is equally effective. Several principles offer a stronger foundation.
Retrieval with feedback
Retrieval means trying to bring knowledge to mind without immediately looking at notes. In statistics, that could mean recalling what the interquartile range measures, choosing a suitable graph from a description of the data, or writing down the first stage of a method.
The attempt matters. If the answer is always visible, you may recognise it without being able to produce it independently. Follow retrieval with feedback because repeatedly recalling an incorrect idea can strengthen the misconception.
Flashcards can help with definitions, but GCSE examination questions must also test application and interpretation. Retrieval should therefore include calculations, graph reading and written reasoning, not only isolated facts.
Spaced practice
One long session can create familiarity without durable knowledge. Spacing means returning to a topic after time has passed.
You might revisit cumulative frequency later in the week, then encounter it again in mixed practice. On each return, try the question before reopening the guide. The cumulative frequency revision guide can then be used to repair a specific gap rather than reread everything.
Mixed practice
Real papers do not announce the method above each question. Mixed practice makes you decide whether the data require an average, a measure of spread, a graph, an estimate or a criticism of the sampling process.
That decision is part of statistical competence. Begin with focused topic questions while learning, then introduce mini tests and past-paper sections. The GCSE Maths topics by board and tier guide can help you check what belongs in your course.
Metacognition without labels
Metacognition means planning, monitoring and evaluating your learning. It is more useful than saying, “I am a visual learner.”
Ask:
- Which questions can I complete without help?
- Where does my method break down?
- Am I confusing familiarity with recall?
- Which error occurs repeatedly?
- What should I change next time?
This treats revision as an adjustable process. A realistic GCSE Maths revision timetable can provide the structure, but your mistakes should decide what fills the sessions.
Build a statistics session that produces evidence
A strong session has a simple rhythm:
Learn
Choose one narrow skill, such as interpreting cumulative frequency, comparing box plots or identifying sampling bias. Use a revision lesson, guide or video to understand the idea.
Retrieve and practise
Put the explanation away. Recall the key method, then answer questions independently. If you are stuck, identify the precise point of difficulty before checking help.
Mark and diagnose
Use the mark scheme or video solution. Do not stop at the total mark. Categorise the problem as missing knowledge, wrong method, inaccurate execution, weak interpretation or a misread question.
Revisit
Schedule another attempt after a gap. Later, place the skill inside mixed practice or a timed paper. This sequence is useful whether you enjoy videos, written notes, diagrams or discussion.
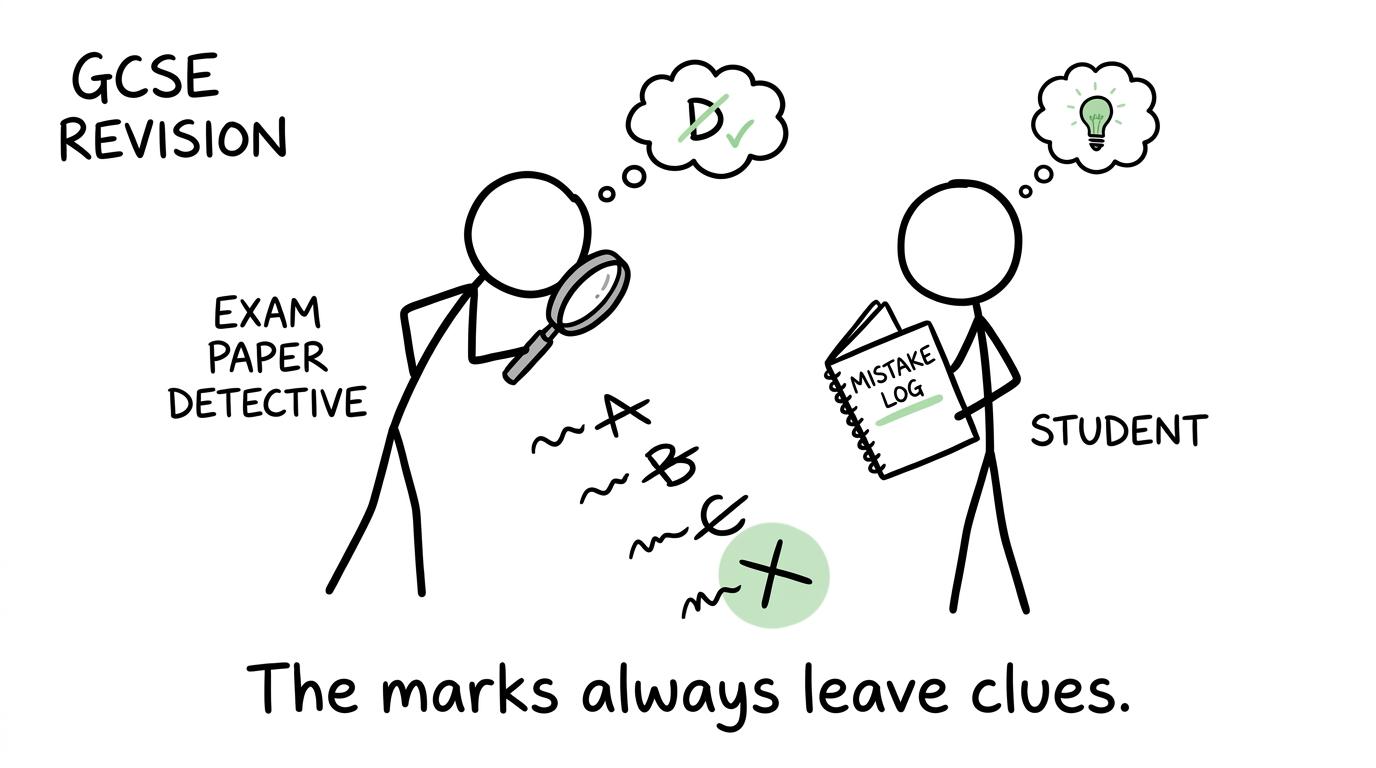 A revision detective investigates where the marks went
Common mistakes when choosing revision methods
Mistaking preference for effectiveness
Enjoying videos does not prove that videos produce the best recall. Keep using them if they help you begin, but test their effect with closed-book questions.
Making attractive notes without testing yourself
Colour and layout can organise information. They cannot show whether you can answer an unfamiliar question. Every note-making session should lead to retrieval or practice.
Avoiding methods that feel difficult
Difficulty is not automatically evidence of good learning, but productive struggle often reveals what you cannot yet do. Do not retreat to passive revision whenever questions become uncomfortable.
Using only one representation
Statistics connects numerical, graphical and verbal information. Restricting yourself to one format can leave gaps. Translate between tables, graphs, calculations and conclusions because examination questions may require all four.
Practising without checking the mark scheme
An answer can be mathematically plausible yet miss the requested comparison, context or justification. Mark schemes help you see how accuracy, working and interpretation earn marks.
Revise the skill, not the label
Learning preferences can make revision more pleasant, and that matters when it helps you start. But preferences should be doors, not walls. GCSE Statistics demands flexible thinking: seeing patterns, calculating carefully, questioning evidence and explaining conclusions.
Start with the free MathsGenie GCSE Statistics resources. Choose the correct exam board and tier, learn one weak topic through a revision lesson, then answer practice questions without support. Use mark schemes and video solutions to diagnose mistakes, mini tests to check retention, and past papers or predicted papers to build examination confidence.
The aim is not to discover what kind of learner you are. It is to gather evidence that your revision is working: one corrected mistake, one revisited topic and one stronger paper at a time.