How to Get Grade 9 GCSE Statistics: Revision Plan
How to get grade 9 GCSE Statistics with focused revision, stronger statistical reasoning, careful error review and effective past-paper practice.
Getting most questions right in class can make a disappointing mock result feel especially confusing. The calculations looked familiar. The graphs seemed manageable. Yet marks disappeared in conclusions, sampling questions and the final lines of explanations.
That gap explains much of how to get grade 9 GCSE Statistics. You need secure methods, but a grade 999 also depends on selecting appropriate techniques, interpreting results in context and evaluating the quality of statistical claims. The most effective revision therefore combines topic knowledge, statistical reasoning, careful error analysis and increasingly demanding exam practice.
Start by checking that you are entered for Higher tier in the separate GCSE Statistics qualification, because Foundation tier does not offer grade 999. If you are revising statistics as part of GCSE Maths instead, the same habits will improve your statistics marks, although you receive an overall Maths grade rather than a separate statistics grade.
Your grade 9 revision checklist
A strong plan should include:
- your exam board's current specification and Higher-tier content;
- regular recall of definitions, formulae and statistical terminology;
- questions that require interpretation and evaluation, not just calculation;
- an error log showing exactly why each mark was lost;
- topic practice followed by mixed and timed practice;
- complete past papers marked with the official mark scheme;
- repeated practice on weak questions after a delay;
- confident use of your calculator and permitted equipment.
Use the GCSE Statistics revision hub to choose the correct exam board and find relevant papers, worksheets and exam questions.
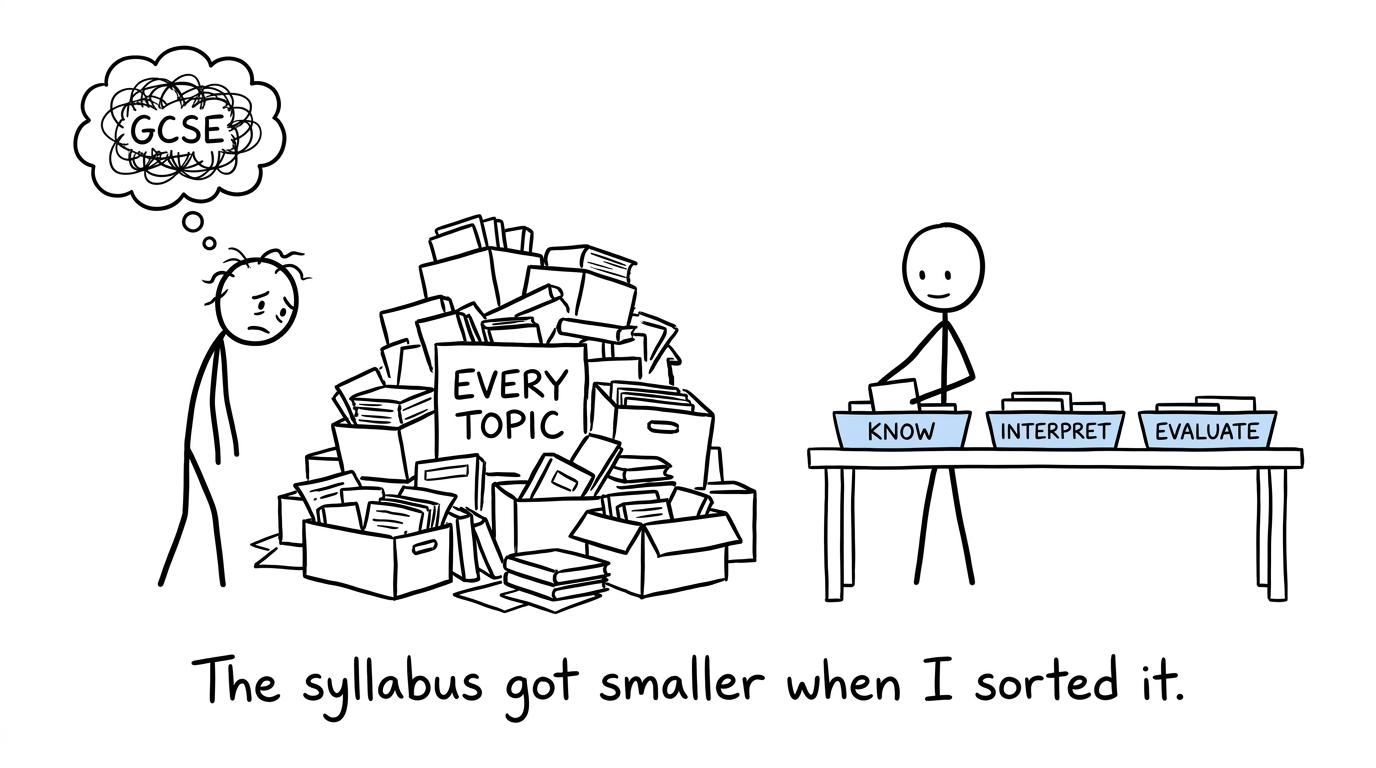 A student makes the Statistics syllabus manageable by sorting it into knowledge, interpretation and evaluation
Understand what a grade 9 paper is testing
GCSE Statistics is not simply a longer collection of averages and charts. Current GCSE Statistics assessment objectives give approximately 55%55\%55% of the marks to knowledge and standard techniques, 25%25\%25% to interpretation and statistical reasoning, and 20%20\%20% to assessing methods and conclusions through the statistical enquiry cycle.
That balance matters. Almost half of the available marks involve more than recalling a process. A student may calculate accurately but still lose marks by failing to:
- relate a comparison to the variables and population;
- distinguish correlation from causation;
- discuss bias or representativeness;
- recognise an unreliable extrapolation;
- evaluate whether the evidence supports a hypothesis;
- explain how a data-collection method could be improved.
This is why simply completing more calculations eventually produces diminishing returns. Grade 999 revision must train all three modes of thought: calculate, interpret and evaluate.
AQA and Pearson Edexcel both assess the full specification across two papers in their current GCSE Statistics qualifications. However, details such as prescribed content, formula requirements and paper instructions must always be checked against your own specification. Students taking GCSE Maths with AQA, Edexcel, OCR or Eduqas should likewise follow the statistics content stated by their Maths exam board.
Turn the specification into a revision map
A specification is more useful than a colourful list of topics because it states what can actually be assessed. Break yours into four broad areas:
- planning investigations, populations, samples and data collection;
- processing and representing data;
- measures, relationships and interpretation;
- probability and the statistical enquiry cycle.
Mark each statement as secure, developing or weak. Be strict. Recognising a term in your notes is not the same as answering an unfamiliar question without help.
Pay particular attention to connected topics. Histograms involve class intervals, boundaries, area and frequency density:
frequency density=frequencyclass width.\text{frequency density}=\frac{\text{frequency}}{\text{class width}}.frequency density=class widthfrequency.Cumulative frequency connects grouped data to medians, quartiles and box plots. The interquartile range is
IQR=Q3−Q1.\operatorname{IQR}=Q_3-Q_1.IQR=Q3−Q1.Probability questions may connect experimental data, relative frequency, independence and conditional reasoning. Strong students do not store these ideas in separate boxes; they practise deciding which idea applies.
Use the cumulative frequency revision guide and box plots revision guide to strengthen two of the most closely linked graphical topics. The cumulative frequency and box plots questions can then test whether you can apply them independently.
Change how you revise statistical knowledge
Rereading creates familiarity. Exams require retrieval.
Close your notes and write everything you know about a topic: definitions, assumptions, limitations, formulae and suitable representations. Then compare your answer with the specification or revision lesson. This reveals omissions that passive reading tends to hide.
Your formula audit should include both meaning and use. For example, knowing
xˉ=∑fx∑f\bar{x}=\frac{\sum fx}{\sum f}xˉ=∑f∑fxis less valuable if you cannot identify when xxx represents a class midpoint and recognise that a grouped-data mean is an estimate. Similarly, knowing a sampling calculation is not enough if you cannot explain whether the resulting sample is representative.
Keep a short definition deck for terms that are easy to confuse: population and sample, quantitative and qualitative, discrete and continuous, interpolation and extrapolation, association and causation, reliability and validity. Practise saying each definition precisely, then applying it to a context.
Build the habit of writing conclusions in context
A bare statement such as “Group A is more consistent” may not earn every available mark. A stronger statistical comparison identifies the measure, gives the direction of the comparison and refers to the context.
Use a simple mental structure:
- evidence: identify the relevant value, feature or pattern;
- comparison: state what is larger, smaller, stronger or more variable;
- context: name the variable and groups involved;
- caution: add a limitation where the question requires evaluation.
Do not force all four parts into every response. Instead, let the command word guide you. “Compare” normally needs similarities or differences supported by measures. “Interpret” requires meaning in context. “Evaluate” asks whether the method or conclusion is defensible.
The same discipline applies to scatter diagrams. Correlation can support a statement about association, but it cannot by itself establish that one variable causes the other. Extrapolation beyond the observed data is also less dependable because the apparent pattern may not continue.
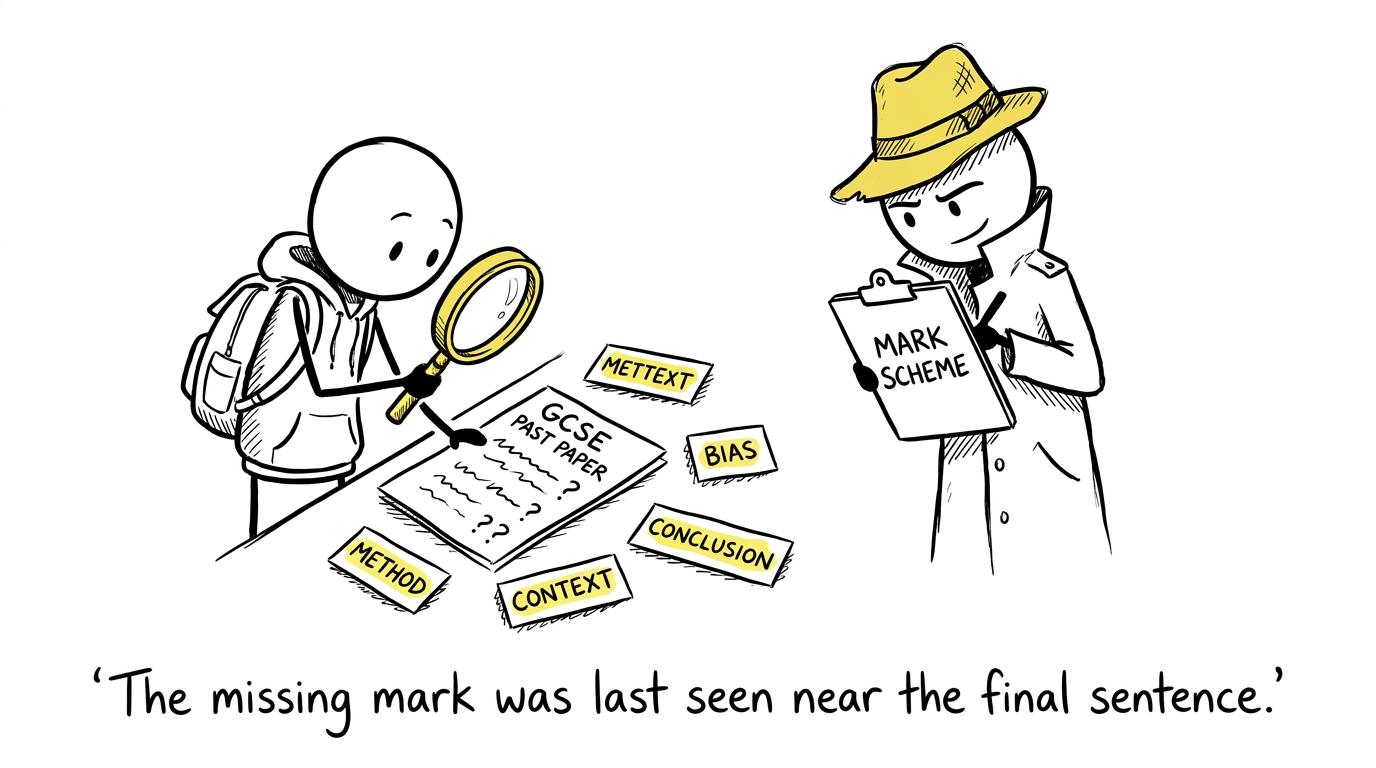 A student investigates a missing mark with clues about method, context, bias and conclusions
Treat the statistical enquiry cycle as a connected argument
The statistical enquiry cycle is often revised as a list. It is better understood as a chain in which each decision affects the next.
A useful investigation begins with a clear question or hypothesis. The population and sampling method must suit that question. The collected data must be relevant and measured consistently. The chosen diagrams and summary statistics must reveal useful features. Finally, the conclusion must match the evidence without claiming more than the investigation can support.
When evaluating an investigation, ask:
- Is the hypothesis clear and testable?
- Does the sample represent the target population?
- Could the question wording or collection method create bias?
- Is the sample large and varied enough to be informative?
- Are the chosen statistics and diagrams appropriate for the data type?
- Does the conclusion acknowledge uncertainty and limitations?
This habit is particularly valuable for unfamiliar scenarios. You may not have seen the context before, but you can still inspect the quality of the statistical process.
Use past papers as diagnosis, not performance
Past papers become powerful when they change what you revise next. Begin with topic questions while knowledge is developing. Move to mixed sections when you need to practise choosing methods. Save some complete papers for realistic timed attempts.
The Edexcel GCSE Statistics revision page brings together revision resources, exam-style questions, worksheets and papers for students following that board. If you use another board, select it through the main Statistics hub rather than assuming every detail is identical.
After marking a paper, classify every lost mark:
- missing knowledge;
- wrong method;
- inaccurate calculation;
- weak interpretation or evaluation;
- misread information;
- poor notation, labelling or rounding;
- time pressure.
Then write a specific repair action. “Revise sampling” is vague. “Practise identifying bias and suggesting one context-specific improvement” tells you what to do.
Redo the question without the solution, then return to it several days later. The second attempt checks understanding; the delayed attempt checks whether the learning lasted. A useful paper-review routine is also set out in the GCSE Statistics resit revision plan.
Do not treat predicted papers as forecasts of exact questions. Use them as additional exam-style practice after covering the whole specification. The guide to using predicted topics sensibly explains why predictions should support complete revision rather than replace it.
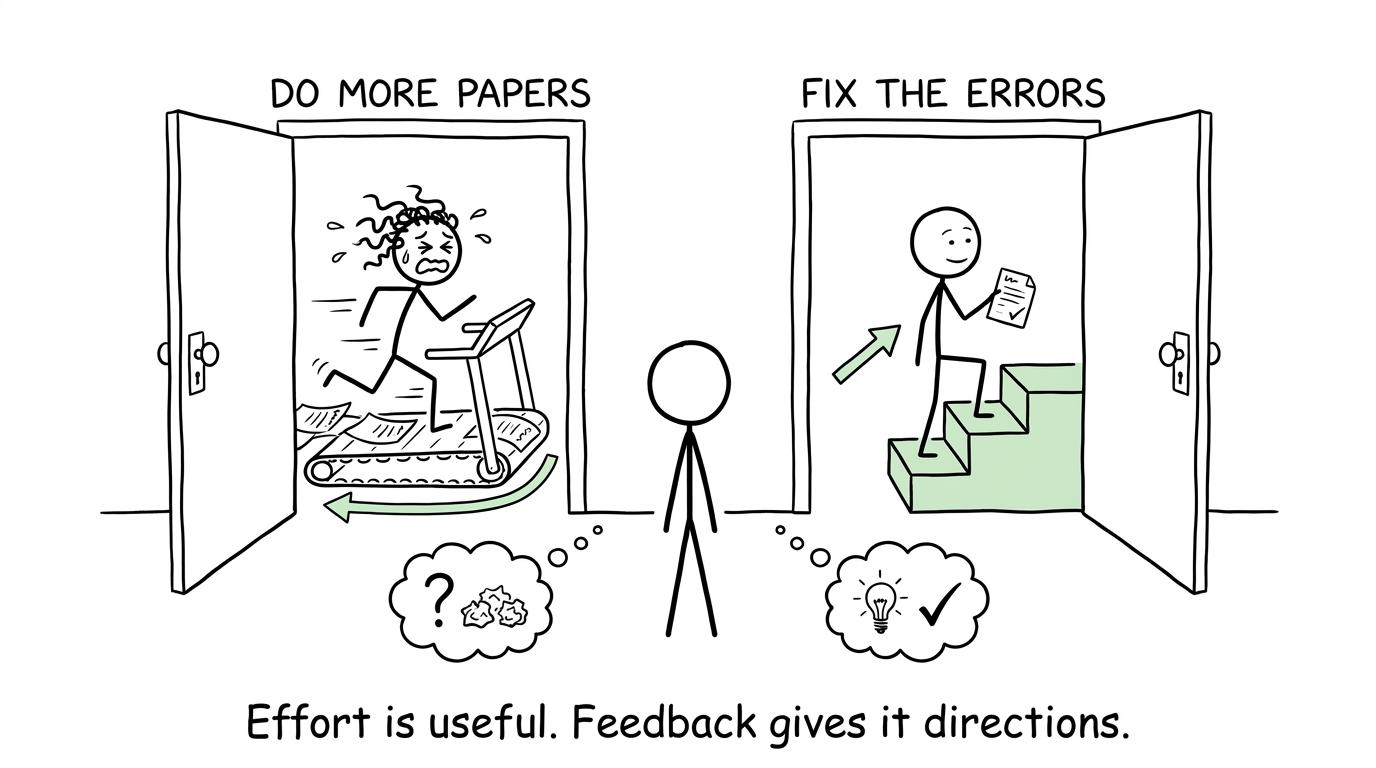 One student runs endlessly through papers while another climbs steps by fixing errors
Practise the small exam habits that protect marks
Grade 999 performance is often less dramatic than students expect. It is built from small, repeatable checks.
Label axes and scales accurately. Use class boundaries rather than assuming stated limits. Show substitutions before relying on a calculator value. Keep unrounded figures during intermediate calculations, then round only at the end unless instructed otherwise. Check whether a question expects an exact value, estimate, probability, percentage or contextual conclusion.
During timed practice, underline command words and important population details. If a multi-mark explanation feels too short, check whether you have supplied evidence and context. If your calculator produces an unexpected answer, estimate its likely size before continuing.
Grade boundaries are set after each examination series and can change, so there is no permanent raw mark that guarantees grade 999. Track improvement in raw marks, but also track the kinds of errors remaining. That gives you a more useful picture of readiness.
Common mistakes that block a grade 9
Revising only difficult calculations
Higher-tier calculations matter, but neglected interpretation marks can be just as costly. Include written statistical reasoning in every revision week.
Giving generic evaluation points
“Use a bigger sample” is not always enough. Explain why the change would improve this investigation, such as representing more sections of the target population or reducing the influence of an unusual result.
Comparing only averages
A full comparison often needs a measure of centre and a measure of spread. Choose statistics that suit the representation and refer to the data's context.
Confusing histogram height with frequency
In a histogram, frequency is represented by area. When class widths differ, bar height alone does not show frequency.
Treating correlation as proof
An association does not demonstrate causation. Other variables may influence the observed relationship.
Completing papers without repairing errors
A stack of marked papers can create the appearance of progress. Improvement comes from identifying the cause of each lost mark and successfully answering a similar question later.
Make your next revision session count
Learning how to get grade 9 GCSE Statistics is not about finding one secret technique. It is about changing the feedback loop. Learn a topic, retrieve it without support, apply it in an unfamiliar context, mark it honestly and repair the precise weakness that appears.
Begin at the MathsGenie GCSE Statistics revision hub. Choose your board, work through the revision lessons and practice questions, then progress to mini tests, past papers and predicted papers where available. Use mark schemes and video solutions to understand lost marks, and place each repair task into your revision planner.
A grade 999 remains demanding. But the path towards it is concrete: know the specification, reason like a statistician and make every mistake useful.