GCSE Statistics Weak Topic: How to Fix It
GCSE statistics weak topic? Diagnose the error, rebuild the method, practise deliberately and retest it with free MathsGenie resources today.
A statistics question appears. You recognise the chart, the table or the wording, but the method slips away again. After several similar experiences, it is tempting to decide that this is simply your GCSE statistics weak topic and spend revision time somewhere more comfortable.
The practical answer is not to avoid it or repeat dozens of questions blindly. Diagnose the precise reason you lose marks, relearn that small skill, practise it without support, and retest it after a gap. A weak topic is rarely one enormous problem. It is usually a short chain with one unreliable link.
This approach works whether you are repairing the statistics content within GCSE Maths or preparing for a separate GCSE Statistics qualification. Your exact content depends on your exam board, specification and tier, so begin at the GCSE Statistics revision hub or your board-specific GCSE Maths page.
Your weak-topic repair checklist
Use this cycle rather than simply writing “revise statistics” on a timetable:
- Find two or three questions you previously answered incorrectly.
- Identify the first point at which your reasoning went wrong.
- Classify the error as knowledge, method, interpretation or exam technique.
- Relearn only the missing idea through a revision lesson or guide.
- Complete a short set of focused questions without notes.
- Mark every answer and write a one-sentence correction.
- Retest the topic after a gap, then place it inside mixed practice.
- Use a past or predicted paper only after the isolated skill is becoming reliable.
The order matters. A full paper can expose a weakness, but focused practice is usually better for repairing it.
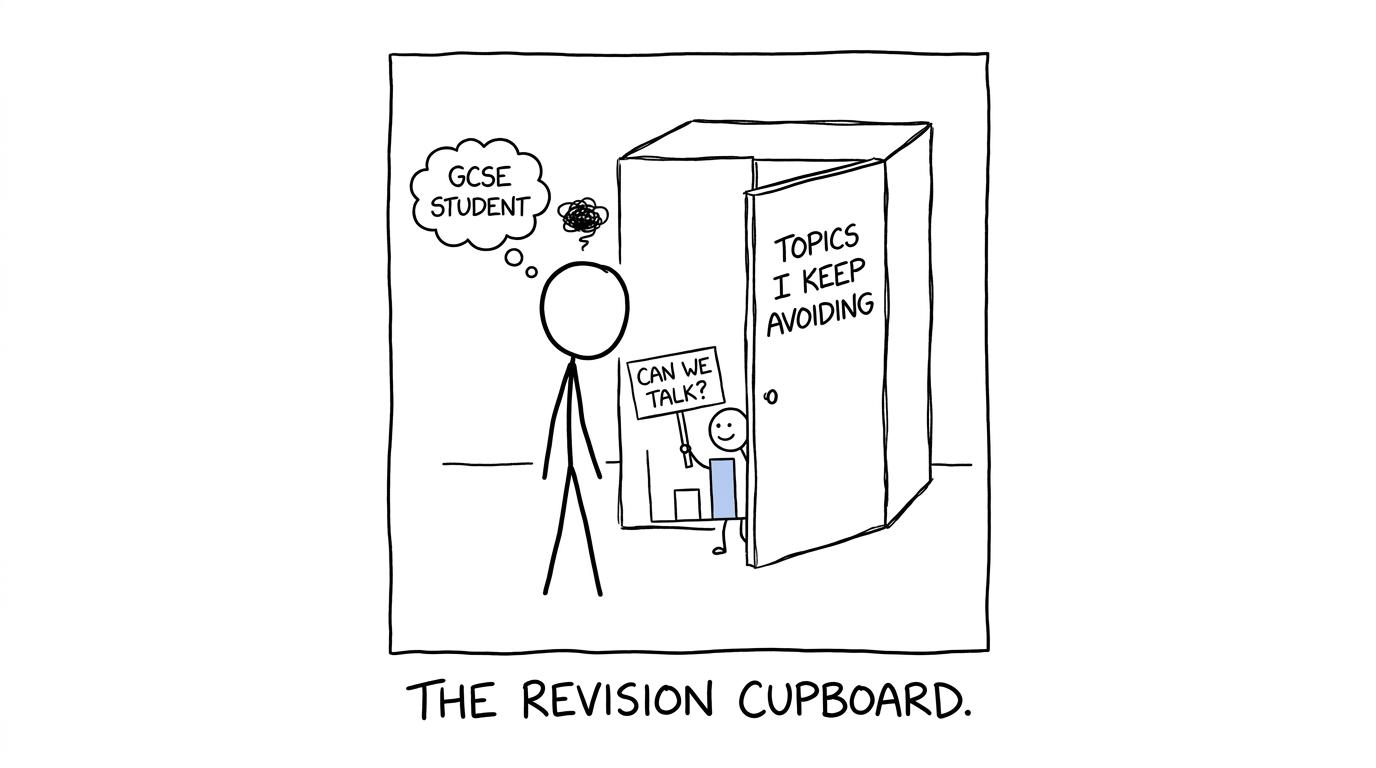 A student discovers the statistics topic hiding in the revision cupboard
Turn “I am bad at statistics” into a precise diagnosis
“Statistics” is too large to be a useful diagnosis. The GCSE Maths subject content includes collecting and representing data, sampling, measures of central tendency and spread, grouped data, charts, scatter graphs and statistical interpretation. Higher-tier content can also include cumulative frequency, box plots and histograms.
Ask a narrower question. Is the difficulty:
- choosing the correct average;
- calculating an estimated mean from grouped data;
- distinguishing frequency from cumulative frequency;
- using class width in a histogram;
- comparing distributions using both centre and spread;
- interpreting correlation without claiming causation;
- reading scales, class boundaries or axis labels;
- explaining a limitation of a sample?
One topic can also contain several different weaknesses. If you can calculate an interquartile range but cannot write a comparison in context, more calculation practice will not solve the real problem.
Sort each lost mark by cause
Use four labels in your revision log:
Knowledge: You did not know a definition, fact or relationship. For instance, the interquartile range is
IQR=Q3−Q1.\text{IQR}=Q_3-Q_1.IQR=Q3−Q1.Method: You knew what the question involved but could not complete the process. A histogram question may depend on
frequency density=frequencyclass width.\text{frequency density}=\frac{\text{frequency}}{\text{class width}}.frequency density=class widthfrequency.Interpretation: Your calculation was possible, but you misunderstood the graph, data or command word. You might describe a larger median while failing to explain what it means in context.
Exam technique: You used the wrong scale, rounded too early, omitted working, missed a unit or gave only one comparison when more information was required.
This classification reflects how GCSE assessment extends beyond routine techniques. Students must also reason, interpret, communicate and solve problems. Therefore, knowing a formula is necessary in some questions, but it is not always sufficient.
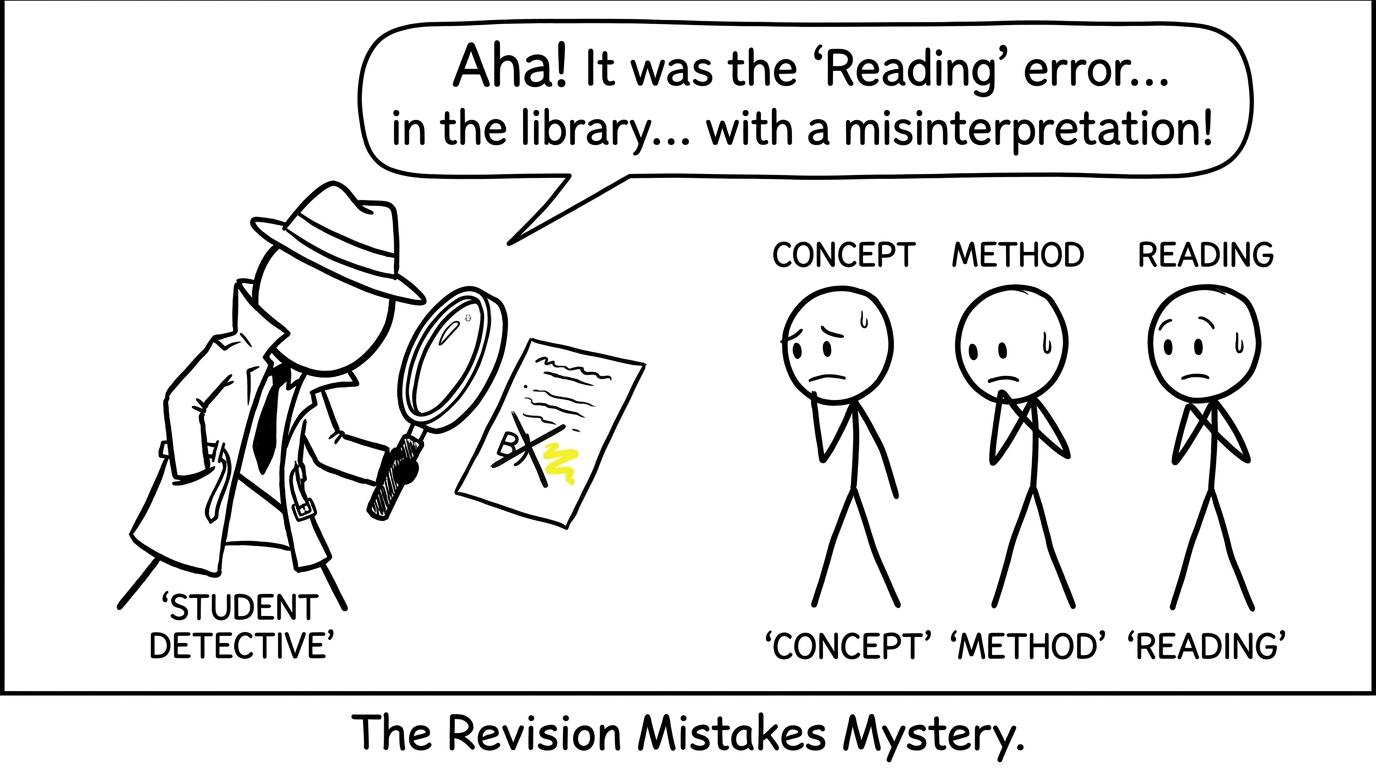 A student detective investigates three possible causes of a wrong answer
Rebuild the smallest missing skill
Once you know the cause, resist restarting the entire statistics unit. Repair the smallest useful component.
If histograms are the problem, separate the skill into recognising continuous grouped data, finding class width, calculating frequency density and interpreting bar area. The MathsGenie histogram revision guide explains the central relationship: frequency is represented by area, not automatically by bar height.
For cumulative frequency, check whether you can form running totals, plot upper class boundaries and locate quartile positions. If the total frequency is NNN, the relevant positions are
N4,N2,3N4.\frac{N}{4},\qquad \frac{N}{2},\qquad \frac{3N}{4}.4N,2N,43N.The cumulative frequency revision guide connects those stages to box plots. You can then use the box plots revision guide to strengthen comparisons involving medians, ranges and interquartile ranges.
If scatter graphs keep causing trouble, decide whether the weakness is plotting, describing correlation, drawing a line of best fit or making a sensible estimate. The scatter graphs revision resources let you target that specific gap rather than revising every form of data presentation.
Practise in layers, not in one exhausting block
Effective revision should gradually remove support. Educational guidance on metacognition recommends planning, monitoring and evaluating learning within the subject being learned. In practical terms, you should know what you are trying to improve, check whether your method is working, and adjust it using evidence from your answers.
Begin with supported recall
Read a concise explanation or watch a revision lesson. Close it and write the method from memory. Your notes might contain a short decision rule, key vocabulary and one or two essential relationships.
Do not copy several pages. The purpose is to create a prompt that helps you think, not a script you can only follow while it remains visible.
Move to focused questions without notes
Complete a small set covering one skill. Mark it immediately, but do not merely count correct answers. For every lost mark, record:
- what you wrote;
- why it was wrong or incomplete;
- what you should notice next time.
A useful correction is specific: “I compared the medians but not the spread.” “Be more careful” is not a strategy.
Retest after a gap
A topic can feel easy when the guide is still open and the method is fresh. The more meaningful test is whether you can select and use that method later without being told what to do.
Reattempt one or two questions after a day or several days. Then mix the topic with other statistics questions. Mixing matters because an exam does not announce, “Use frequency density now.” You must recognise the structure independently.
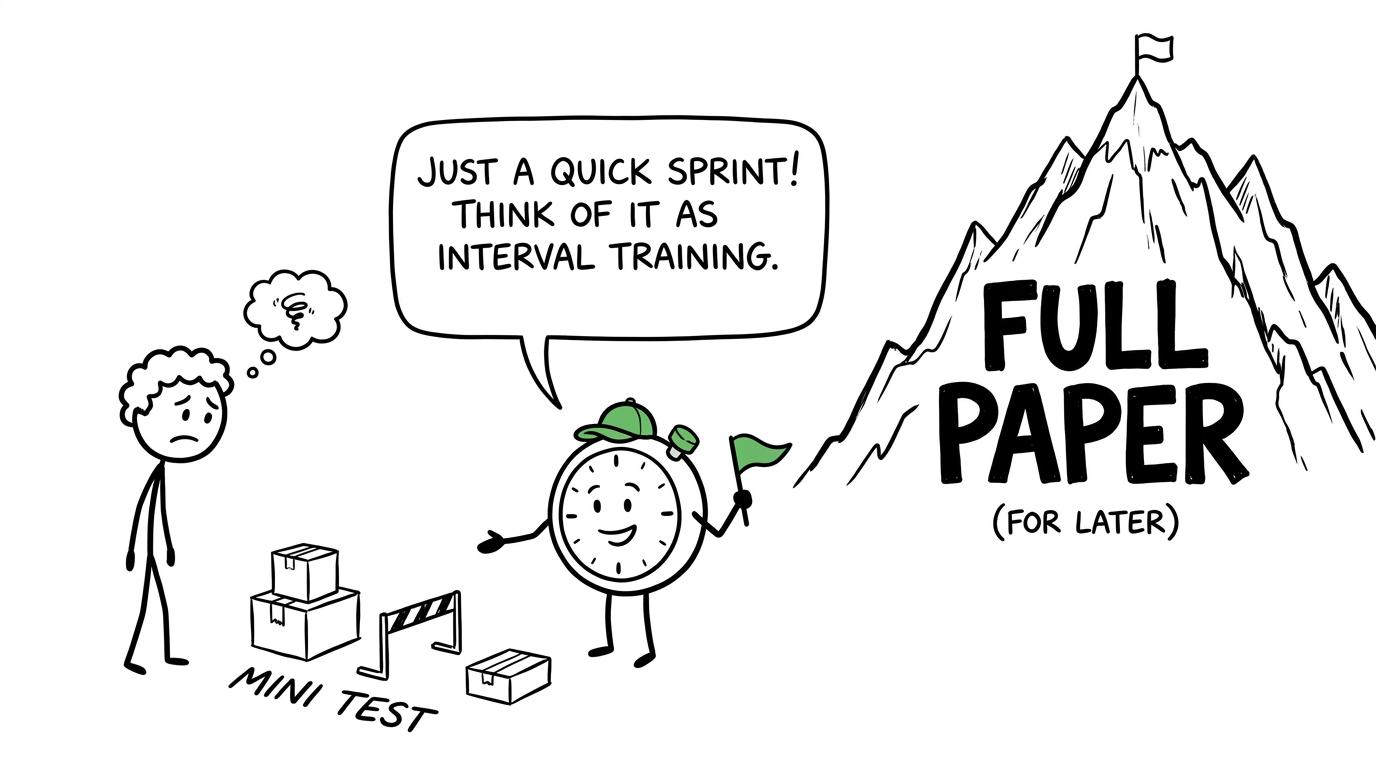 A student tackles a mini test before climbing the full-paper mountain
Learn what the question is asking you to communicate
Statistics answers often need language as well as calculation. Build a command-word checklist.
Calculate means show a valid numerical method and give an appropriately accurate answer.
Estimate signals that grouped data, a graph or a model does not provide an exact value. Avoid presenting the result as exact.
Compare usually requires a direct statement about both data sets. For distributions, consider a measure of centre and a measure of spread, then interpret them in context.
Explain requires a reason. Naming “bias” without identifying how the sampling method could favour certain responses may be too vague.
Evaluate asks you to judge suitability or reliability, often using sample size, sampling method, data collection, assumptions or the limits of a conclusion.
Correlation also needs disciplined wording. A scatter graph can suggest an association, but correlation alone does not establish that one variable causes the other. Predictions beyond the observed data are extrapolations and should be treated cautiously.
Know when the topic is actually improving
Do not promote a topic from “weak” to “fixed” because one question went well. Use evidence.
A topic is becoming secure when you can:
- explain the key idea without reading notes;
- recognise the method in unfamiliar wording;
- complete several questions accurately;
- state why previous answers were wrong;
- use the skill inside a mixed or timed set;
- return later and still remember the process.
A simple confidence score can help, provided it follows performance rather than mood. Use 000 for “cannot begin”, 111 for “can complete with support”, 222 for “usually independent” and 333 for “reliable in mixed practice”. Add the retest to your GCSE maths revision timetable rather than assuming the work is finished.
Common mistakes when fixing a GCSE statistics weak topic
Repeating questions without diagnosing errors
Volume is not the same as improvement. If you repeatedly misread class widths, every unchecked answer rehearses the same mistake. Stop, identify the cause and correct the process.
Reading solutions too early
A solution can create recognition without independent recall. Attempt the question first, even if your first step is uncertain. Then compare your reasoning with the mark scheme or video solution.
Practising only easy versions
Start with accessible questions, but do not remain there. Progress towards unfamiliar layouts, interpretation and mixed questions that require you to choose the technique.
Ignoring written conclusions
Correct calculations do not automatically produce complete statistical arguments. Practise conclusions in context, comparisons using centre and spread, and comments about reliability.
Using full papers as the only revision method
Papers are valuable for diagnosis, timing and mixed practice. They are inefficient when a single skill needs rebuilding. Topic work should repair the gap before another paper tests it.
Switching exam boards carelessly
Edexcel, AQA, OCR and Eduqas draw on common national GCSE Maths content, but their specifications, paper structures and wording are not identical. Use resources matched to your own board and tier. Students taking the separate qualification can choose their board through MathsGenie’s Statistics hub; for example, the Edexcel GCSE Statistics revision page brings together lessons, questions, worksheets and papers.
Make the weakness prove that it is fixed
The final stage is pressure testing. Complete a mini test or a relevant section of a paper without notes. Mark it carefully and return to the topic if the same error appears. When focused practice is secure, use Edexcel GCSE Maths predicted papers or the appropriate past papers for your board to test recognition, timing and communication.
A weak topic does not need a dramatic rescue. It needs an honest diagnosis, a small repair and enough spaced retesting to make the method dependable. Begin with one question you previously got wrong. Name the exact failure, open the matching MathsGenie revision lesson, complete the practice questions, and check your work with the mark scheme or video solution.
Then schedule the retest. MathsGenie’s free revision lessons, practice questions, mini tests, past papers, predicted papers, mark schemes, video solutions and revision planning resources give you the complete path from “I always get this wrong” to “I know what to do next.”