GCSE Statistics Topics Breakdown: Revision Priorities
GCSE statistics topics breakdown covering likely priorities, tier differences and a practical revision-time plan for making stronger progress in maths.
A statistics question can look friendly. There may be a small table, a familiar chart and no intimidating wall of algebra. Then one phrase changes everything: compare the distributions, estimate the mean or comment on the sample.
This GCSE statistics topics breakdown gives you the practical answer before anything else: prioritise averages and frequency tables first, then data representation and interpretation. Higher-tier students should give extra time to cumulative frequency, box plots and histograms. Sampling and scatter graphs need less calculation, but they still deserve focused practice because imprecise conclusions can quietly lose marks.
There is no official exam-board weighting for each individual statistics topic. Across GCSE Maths, probability and statistics together account for approximately 15%15\%15% of the overall assessment at both tiers. That is an overall guide, not a promise about any particular paper. The revision percentages below are therefore sensible time allocations, not predictions of exact exam marks.
GCSE statistics revision checklist
Use this quick audit before deciding where your next hour should go:
- Can you choose and calculate the mean, median, mode and range?
- Can you find or estimate averages from frequency tables?
- Can you select and interpret bar charts, pie charts, frequency polygons and time-series graphs?
- Can you compare two distributions using both an average and a measure of spread?
- Can you interpret scatter graphs without claiming that correlation proves causation?
- Can you explain why a sample may be biased or unrepresentative?
- If you take Higher tier, can you use cumulative frequency graphs, box plots and histograms?
If several answers are “not yet”, do not revise everything equally. Equal time feels organised, but it ignores where marks are actually leaking.
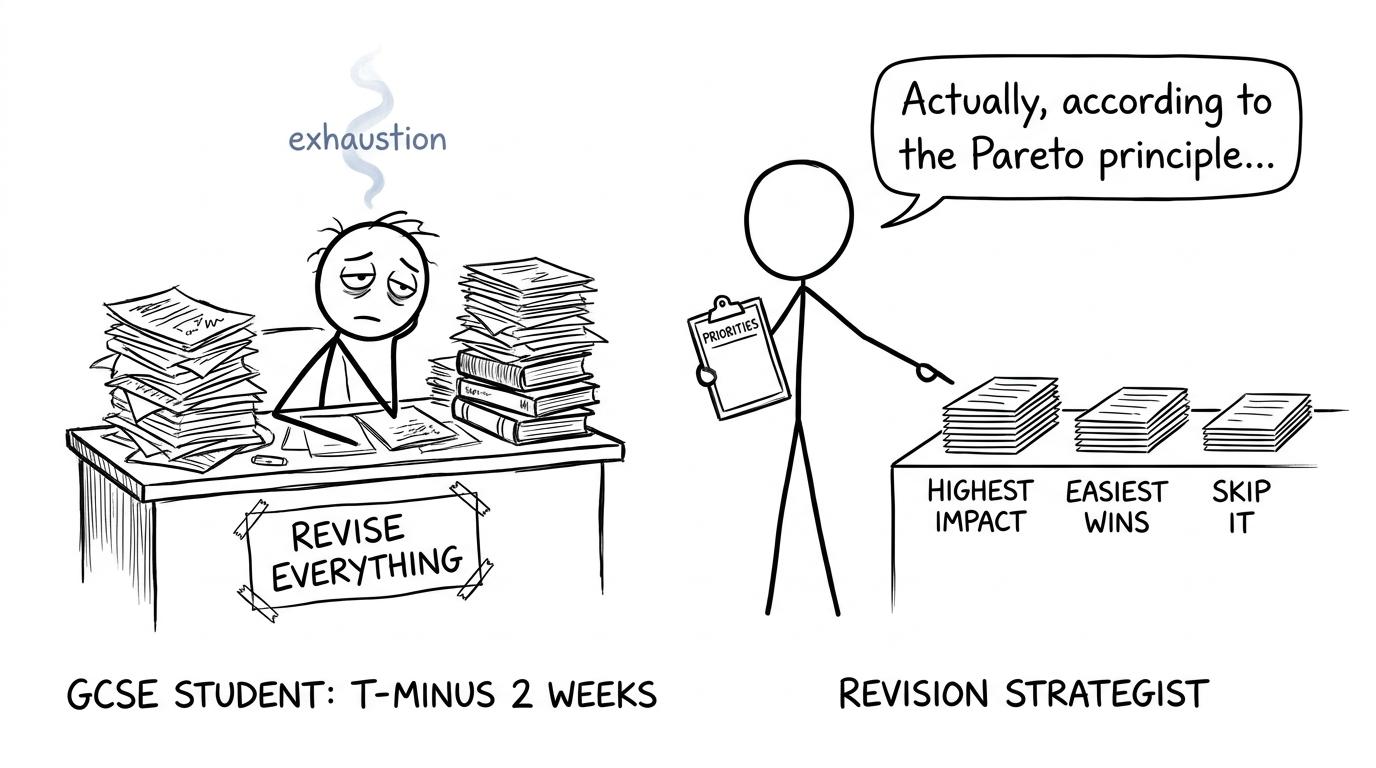 A student replaces a huge revise-everything pile with a calmer set of priorities
How much of GCSE Maths is statistics?
The national GCSE Maths content used by Edexcel, AQA, OCR and Eduqas is arranged into number, algebra, ratio and proportion, geometry, probability and statistics. Exam boards may organise resources and papers differently, but the mathematical core is broadly shared.
AQA publishes an approximate combined weighting of 15%15\%15% for probability and statistics at both Foundation and Higher tier. The regulated content and assessment model mean this weighting concerns the qualification as a whole, not every individual paper. Any permitted topic may appear wherever the board's paper structure allows it.
Statistics alone is therefore not guaranteed a fixed percentage. Probability shares the same broad allocation. That makes past-paper evidence from your own board more useful than any claim that histograms, averages or sampling will be worth a particular number of marks next time.
You can check the wider context in the GCSE Maths topics by exam board and tier, then choose your board from the GCSE Maths revision hub.
A suggested GCSE statistics topics breakdown by revision time
The table assumes that statistics is one area within your complete GCSE Maths plan. Adjust it after marking a diagnostic paper.
| Statistics area | Suggested share of statistics revision time | Main reason |
|---|---|---|
| Averages, spread and frequency tables | 25%25\%25% | Core methods connect to many representations and comparison questions |
| Charts, tables and data interpretation | 20%20\%20% | Broad coverage with frequent opportunities for accessible marks |
| Comparing distributions | 15%15\%15% | Tests interpretation as well as calculation |
| Scatter graphs and time series | 10%10\%10% | Requires precise contextual language and sensible predictions |
| Sampling, populations and bias | 10%10\%10% | Shorter methods, but reasoning must be specific |
| Cumulative frequency and box plots | 10%10\%10% | Important Higher-tier graphical skills |
| Histograms and frequency density | 10%10\%10% | Demanding Higher-tier topic where several ideas connect |
For Foundation tier, move most or all of the final 20%20\%20% towards averages, charts, sampling and scatter graphs unless your board's specification or teacher directs otherwise. For Higher tier, keep cumulative frequency, box plots and histograms firmly in the plan.
These percentages should move with your performance. If a short test shows that you are already secure on averages but cannot interpret a histogram, your personal weighting should change. Revision is best treated as a response to evidence, not a timetable carved in stone.
Averages, spread and frequency tables
Start here because these ideas travel. Mean, median, mode and range appear directly, but they also support grouped data, cumulative frequency and comparisons between distributions.
Know the basic structures:
mean=total of the valuesnumber of values\text{mean}=\frac{\text{total of the values}}{\text{number of values}}mean=number of valuestotal of the valuesFor a frequency table:
mean=∑fx∑f\text{mean}=\frac{\sum fx}{\sum f}mean=∑f∑fxFor grouped data, class midpoints replace exact values, so the result is an estimate:
estimated mean=∑fm∑f\text{estimated mean}=\frac{\sum fm}{\sum f}estimated mean=∑f∑fmHere, fff is frequency and mmm is the class midpoint. The more important exam skill is not simply recalling the formula. It is recognising whether the table contains exact values or grouped intervals, and explaining why a grouped-data answer is estimated.
Use the averages from frequency tables revision guide to review the method, then move directly to practice questions and mark schemes.
Charts, tables and statistical interpretation
This area includes frequency tables, bar charts, pie charts, pictograms, vertical line charts, frequency polygons and line graphs for time series. Questions may ask you to complete a representation, choose a suitable one or explain what it shows.
The choice of chart depends on the type of data. Separate categories suit a bar chart. Data changing over time suits a time-series graph. Grouped continuous data may require a histogram at Higher tier. A scatter graph is used when investigating a relationship between two variables.
Interpretation deserves as much attention as construction. Check scales, labels, units, unequal intervals and whether a graph exaggerates a difference. A technically accurate calculation does not rescue a conclusion based on a misleading axis.
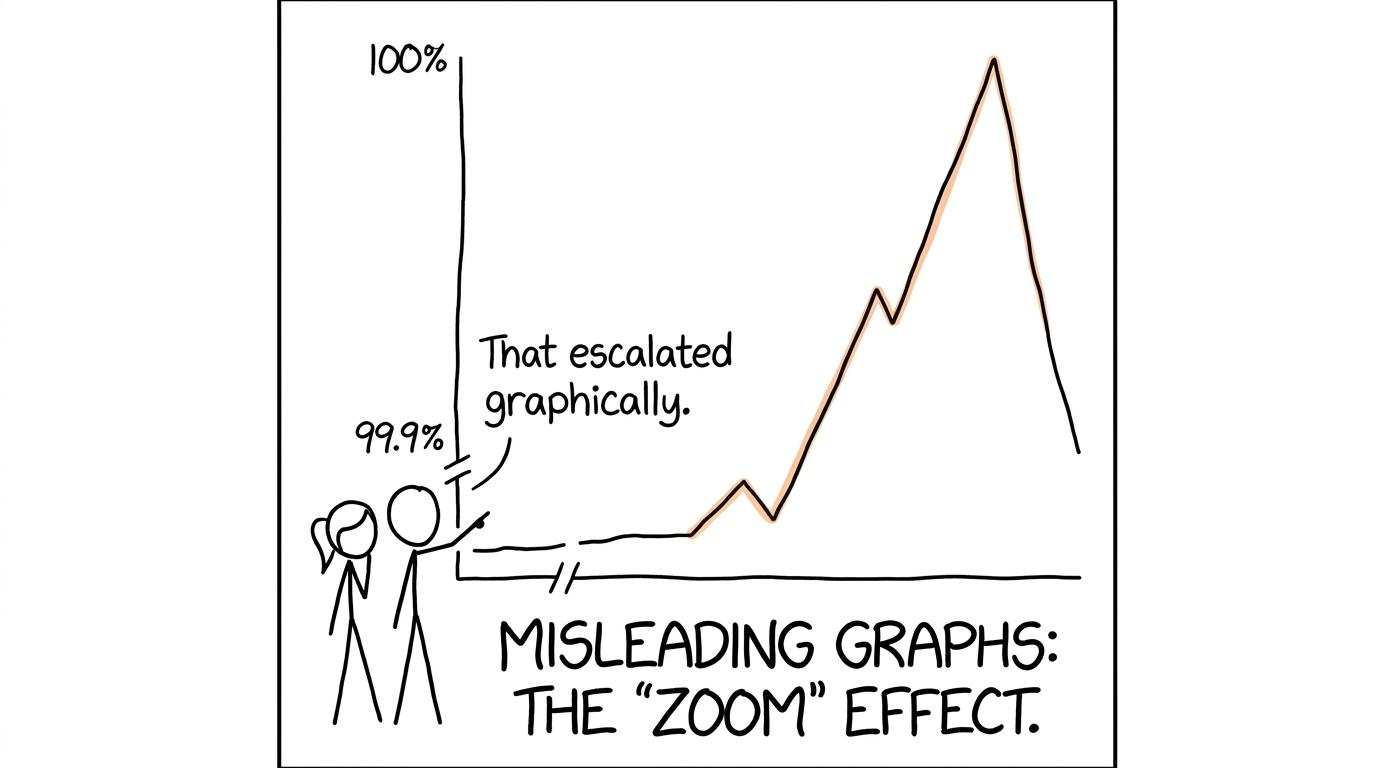 Two students discover that a dramatic graph has a suspiciously shortened axis
Comparing distributions
A comparison needs evidence. Usually, that means discussing a suitable measure of central tendency and a suitable measure of spread.
The range is:
range=highest value−lowest value\text{range}=\text{highest value}-\text{lowest value}range=highest value−lowest valueAt Higher tier, the interquartile range is:
IQR=Q3−Q1\operatorname{IQR}=Q_3-Q_1IQR=Q3−Q1An average describes where a distribution is centred. A measure of spread describes consistency or variation. Saying that one group “did better” from its range alone is not valid because range does not describe a typical value. Likewise, comparing only the medians ignores how dispersed the results are.
Strong responses name both groups, quote or compare relevant values and interpret those differences in context. Practise complete sentences as well as calculations.
Scatter graphs and time series
Scatter graphs assess whether you can recognise positive, negative or no correlation, judge its strength and use a line of best fit. Interpolation means predicting within the observed data range; extrapolation means predicting beyond it and is generally less reliable.
The central warning is simple: correlation does not establish causation. Two variables moving together does not prove that one causes the other. A third factor may affect both, or the relationship may be coincidental.
Time-series graphs focus on change over time. Look for an overall trend, repeated seasonal patterns and unusual values. Avoid descriptions such as “it goes up and down” when the graph supports something more precise.
Sampling, populations and bias
Sampling questions contain fewer calculations, which can make them easy to postpone. Yet they test whether you understand how trustworthy a statistical conclusion is.
You should be able to distinguish between a population and a sample, recognise potential bias and explain why a sample may not represent the intended population. A larger sample may reduce random variation, but size alone does not remove bias. Asking many people from one narrow group can still produce poor evidence.
Criticism must be specific. “The sample is biased” is weaker than identifying who was excluded, who was over-represented or how the collection method could influence responses.
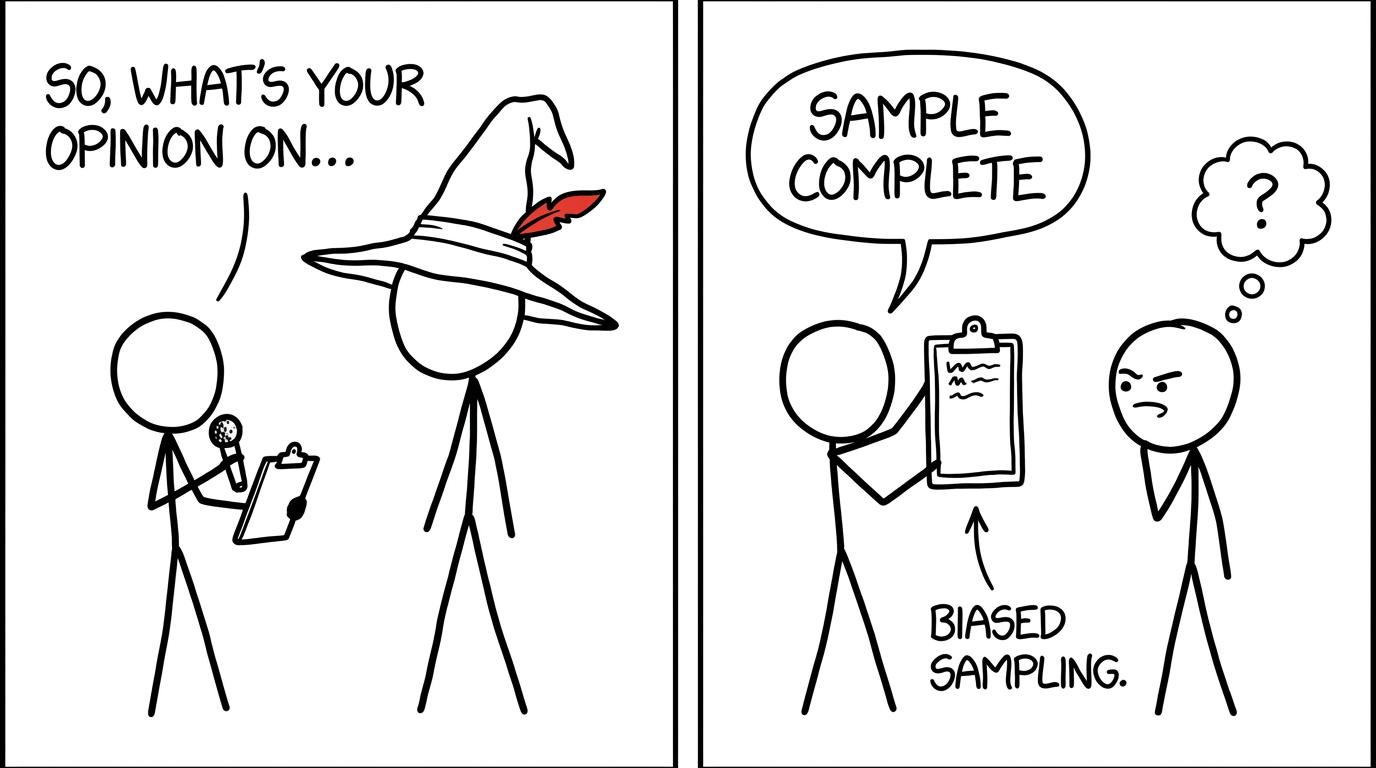 A student confidently completes a survey after asking one spectacularly unrepresentative person
Higher-tier priorities: cumulative frequency and histograms
Cumulative frequency links grouped data, quartiles and box plots. For total frequency NNN, the usual positions are:
Q1:N4,median:N2,Q3:3N4Q_1:\frac{N}{4},\qquad \text{median}:\frac{N}{2},\qquad Q_3:\frac{3N}{4}Q1:4N,median:2N,Q3:43NPlot cumulative frequency against upper class boundaries and remember that the graph represents a running total. Review this connection through the cumulative frequency revision guide.
Histograms require a different reading habit. Frequency is represented by bar area, not automatically by height. For unequal class widths:
frequency density=frequencyclass width\text{frequency density}=\frac{\text{frequency}}{\text{class width}}frequency density=class widthfrequencyTherefore:
frequency=class width×frequency density\text{frequency}=\text{class width}\times\text{frequency density}frequency=class width×frequency densityThis topic is worth deliberate practice because a question can combine class boundaries, scales, missing frequencies and interpretation. The histograms revision guide brings those links together.
Common mistakes that lose statistics marks
- Treating every average as interchangeable: choose the statistic that suits the data and context.
- Forgetting frequencies: for a frequency-table mean, use fxfxfx, not just the listed values.
- Calling an estimated mean exact: grouped intervals do not reveal every original value.
- Comparing only averages: include spread when comparing distributions.
- Reading histogram height as frequency: use bar area and frequency density.
- Plotting cumulative frequencies at midpoints: use upper class boundaries.
- Claiming correlation proves causation: describe the association without inventing a cause.
- Giving vague sampling criticism: identify the source of bias and its likely effect.
- Ignoring units and context: conclusions should refer to the quantities being measured.
- Trusting a distorted graph: inspect scales, intervals, labels and omitted information.
Turn the breakdown into a revision plan
Begin with one board-and-tier diagnostic paper. Mark it carefully and tag every lost statistics mark by topic. Then spend roughly 60%60\%60% of your statistics time repairing the weakest two areas, 25%25\%25% maintaining secure core skills and 15%15\%15% on mixed retrieval.
A useful session has a short rhythm: learn, practise, mark, correct and retest. MathsGenie keeps those stages close together through revision lessons, question banks, worksheets, mark schemes and video solutions. If you take a separate GCSE Statistics qualification, the GCSE Statistics revision hub also provides board-specific papers and resources.
Once individual topics feel stable, move to full papers. Use official past papers to measure readiness, then use GCSE predicted papers as additional practice rather than as a substitute for complete specification coverage.
Make your next revision hour evidence-led
Statistics rewards a particular kind of calm attention. You calculate, but you also question: Is this sample fair? Is this graph honest? Does this conclusion go beyond the evidence?
Start on the MathsGenie GCSE Maths revision hub, choose the weakest area revealed by your latest paper and complete one focused revision lesson followed by practice questions. Mark the work immediately, record the exact mistake and retest it later.
Then build towards past papers, mini tests and predicted papers. The goal is not to give every topic equal time. It is to make every revision session change what happens when the next statistics question appears.