GCSE Statistics Grade 4 Meaning: A Clear Guide
GCSE statistics grade 4 meaning explained: what this standard pass shows, how it compares with the old grade C, and how to improve your next result.
A grade can feel strangely final. Months of lessons, calculations and exam questions are compressed into one number on a results sheet. If that number is a grade 4, you may wonder whether you passed, what it says about your ability and whether it is enough for your next step.
The short answer to the GCSE statistics grade 4 meaning is this: a grade 4 is a standard pass and a Level 2 grade. Its lower boundary is comparable with the lower boundary of the old grade C. It shows that you have demonstrated a credible foundation in statistical knowledge, interpretation and evaluation, but it does not mean that you have mastered every topic.
It is also important to distinguish standalone GCSE Statistics from the statistics content inside GCSE Maths. A grade 4 in GCSE Statistics is a result for a separate qualification. It does not replace any requirement to achieve a particular grade in GCSE Maths.
Grade 4 at a glance
Here is the essential checklist:
- Grade 4 is officially recognised as a standard pass.
- It sits at the Level 2 threshold of the GCSE grading scale.
- The bottom of grade 4 is comparable with the bottom of the former grade C.
- It is not accurate to convert every numbered grade directly into one old letter grade.
- Grade 5 is one grade higher and has commonly been described as a strong pass.
- There is no permanent percentage needed for grade 4 because grade boundaries can change between exam series and specifications.
- Entry requirements are set by individual sixth forms, colleges, employers and training providers.
You can see the available exam-board resources on the GCSE Statistics revision hub.
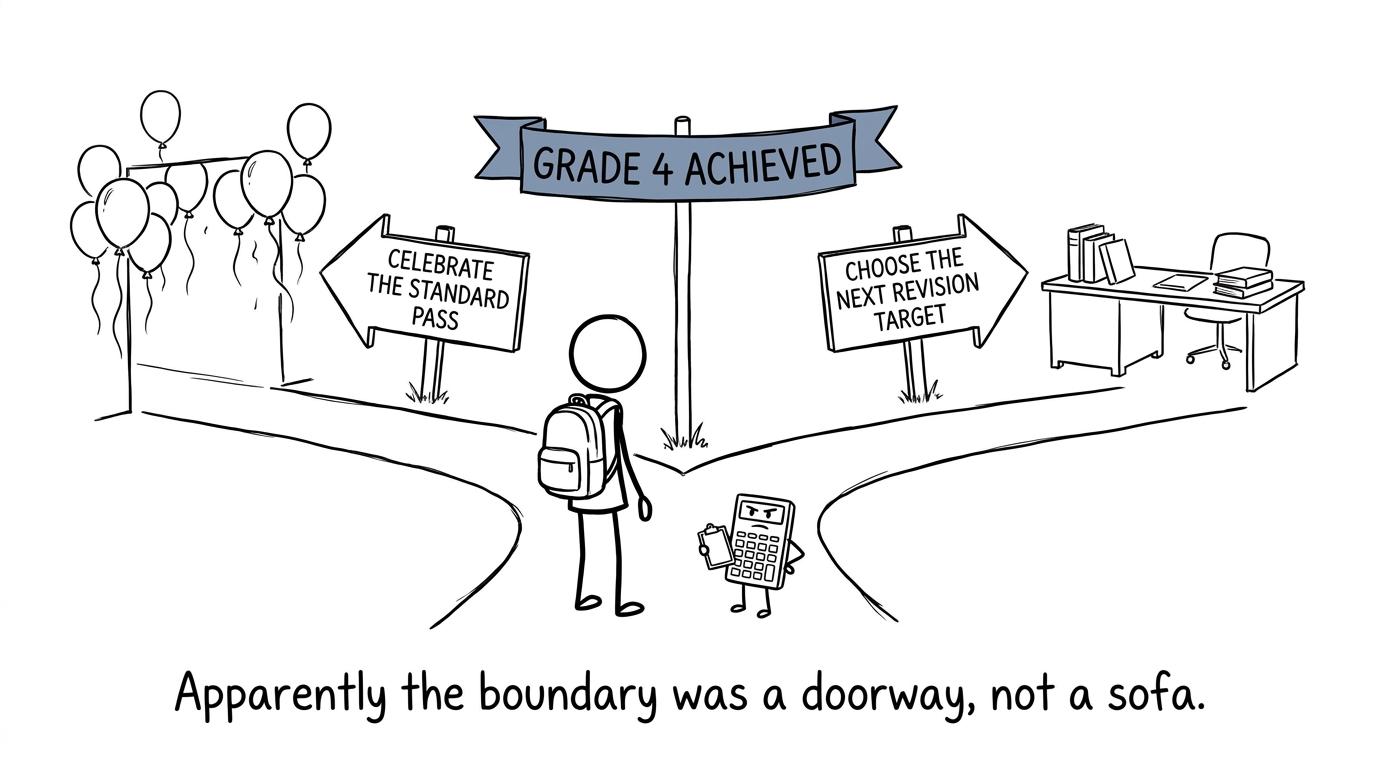 A student discovers that a grade boundary is a doorway rather than a sofa
What does a grade 4 represent in terms of ability?
A grade 4 indicates that your total exam performance reached the boundary set for that grade. It is evidence that you can use a meaningful range of statistical ideas at GCSE level.
However, grades are awarded from your total mark, not from a separate checklist saying that every grade 4 student can complete precisely the same tasks. Two students can earn the same grade while having different strengths. One might be confident with probability and averages but weaker at evaluating samples. Another might explain bias well but lose marks on calculations.
Knowledge and statistical techniques
At this level, a student will usually have gained marks by demonstrating knowledge of standard techniques. Depending on the specification and tier, these can include:
- identifying populations, samples and types of data;
- organising and representing information;
- calculating averages and measures of spread;
- interpreting charts, tables and diagrams;
- working with probability;
- recognising patterns, association and correlation.
Core relationships may include the arithmetic mean,
mean=sum of the valuesnumber of values,\text{mean}=\frac{\text{sum of the values}}{\text{number of values}},mean=number of valuessum of the values,and the interquartile range,
IQR=Q3−Q1.\text{IQR}=Q_3-Q_1.IQR=Q3−Q1.These formulas matter, but GCSE Statistics is not simply a collection of calculations. A correct number without an interpretation may not answer the full question.
If frequency tables are a weak area, use the averages from frequency tables revision guide. The GCSE probability revision guide is also useful for strengthening foundational probability skills.
Interpretation in context
Official GCSE Statistics assessment objectives do more than reward recall. Across the qualification, students are expected to interpret statistical information, reason in context and draw conclusions.
That means noticing what a result actually says. A difference between two averages may matter, but the spread of each distribution also affects the comparison. A correlation may suggest an association, but it does not by itself establish causation. An estimate taken outside the observed range may be unreliable.
These are habits of thought rather than isolated tricks. The scatter graphs revision guide can help you revise correlation, lines of best fit and sensible predictions.
Evaluation and the statistical enquiry cycle
GCSE Statistics also assesses whether you can judge the appropriateness of methods and conclusions. You may need to consider:
- whether a sample represents the population;
- how bias could have entered the investigation;
- whether a graph or summary statistic is appropriate;
- whether the available evidence supports a conclusion;
- how an investigation could be improved.
For current GCSE Statistics specifications, the broad assessment weighting is approximately 55%55\%55% for demonstrating knowledge and techniques, 25%25\%25% for interpretation and statistical reasoning, and 20%20\%20% for evaluating methodology and conclusions. This explains why memorising formulas alone is unlikely to secure all the available marks.
A grade 4 therefore represents more than basic arithmetic. It shows some successful performance across calculation, interpretation and evaluation, even if that performance was not yet consistent across the whole course.
How does grade 4 compare with the old letter grades?
The safest comparison is precise but limited: the bottom of grade 4 is aligned with the bottom of the old grade C.
This makes grade 4 the nearest current equivalent when an older requirement refers to a grade C. It does not mean that the entire numbered scale can be translated neatly, grade by grade, into letters. The current scale contains more grades in the upper range and was designed to provide greater differentiation.
So it is reasonable to describe grade 4 as broadly comparable with an old grade C, particularly at the pass threshold. It is less accurate to treat the two grading systems as interchangeable conversion charts.
Grade 5 sits above this threshold and has been described in government reporting as a strong pass. That description does not turn grade 4 into a near miss. Grade 4 remains a recognised standard pass.
Why grade 4 is not a fixed percentage
One of the most persistent GCSE myths is that the same percentage always produces the same grade. It does not.
A grade boundary is the minimum total mark required for a grade in a particular exam series. Awarding organisations set boundaries after the papers have been taken, taking account of the demand of the assessments and evidence about standards. Boundaries can therefore differ between years, boards, specifications and tiers.
Your final GCSE Statistics result is based on your combined performance across the qualification rather than a separate grade for each paper. A weaker paper can be balanced by a stronger one because the relevant marks are combined before the overall grade is awarded.
This is why a target such as “I need exactly 50%50\%50%” can be misleading. A more useful target is to build a margin above recent grade boundaries while improving the topics and question types that repeatedly cost you marks.
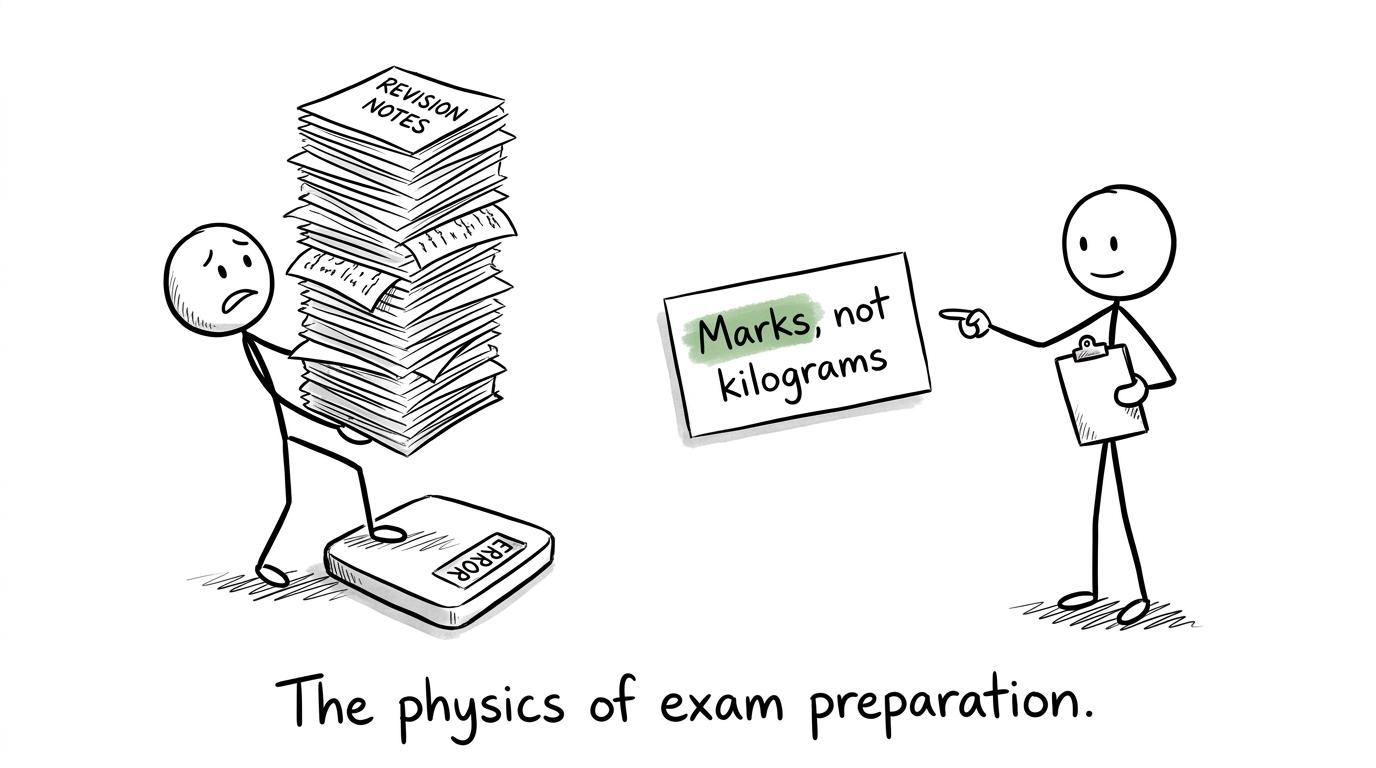 A student weighs revision notes while an examiner asks for marks instead
Foundation and higher tier implications
Standalone GCSE Statistics is tiered on major specifications such as AQA and Pearson Edexcel. Foundation tier offers grades 1 to 5, while higher tier targets grades 4 to 9. Higher tier may include a limited allowed grade 3 for a candidate who narrowly misses grade 4, subject to the awarding rules.
A grade 4 can therefore be achieved through either tier, but the papers do not have identical demand. On foundation tier, grade 4 sits below the highest available grade. On higher tier, it is normally the lowest full target grade.
Tier choice should be made with your teacher. It depends on your current performance, topic knowledge and how securely you can access the questions on each paper. The number printed on the result does not record how stressful the route felt. It records the standard reached.
Pearson Edexcel students can find tier-matched resources, worksheets and papers on the Edexcel GCSE Statistics revision page.
Is a grade 4 enough for college or future study?
A grade 4 is a genuine Level 2 achievement, but it is not a universal entry guarantee. Sixth forms, colleges, apprenticeships and employers can set their own requirements. A course involving substantial mathematics or statistics may ask for a higher GCSE Maths grade or a particular overall GCSE profile.
If you hope to take A Level Maths, Psychology, Geography, Biology, Economics or another data-rich subject, statistical confidence will help. Yet the entry requirement will usually refer specifically to GCSE Maths and sometimes other named subjects. Check the published requirements for your intended course rather than assuming that a grade 4 in GCSE Statistics satisfies them.
The post-16 rule requiring students without grade 4 in English or maths to continue studying those subjects concerns GCSE English and GCSE Maths. It does not apply in the same way to standalone GCSE Statistics, and a Statistics grade cannot be used as a substitute for the required Maths result.
How to move from grade 4 towards grade 5 or above
The most effective improvement usually comes from finding where marks leak away. Your grade tells you the total outcome. Your marked work tells you what to change.
Diagnose before revising everything
Complete a paper or substantial mixed section under realistic conditions. Then use the mark scheme and label each lost mark:
- Knowledge: you did not know the fact or method.
- Interpretation: you calculated something but did not explain it in context.
- Evaluation: your criticism or improvement was too vague.
- Accuracy: you knew the method but made a numerical or graphing error.
- Timing: you did not reach or complete the question.
Use the GCSE past papers collection to build exam familiarity, and follow the guide to using past papers properly so that marking leads to focused revision rather than just another score.
Repair one weakness at a time
A simple revision cycle works well:
- review the relevant revision lesson;
- complete targeted practice questions;
- check every response against the mark scheme;
- write down the exact correction;
- retest the skill after a few days;
- return to a mixed paper when the topic feels secure.
For higher-tier data representation, the histograms revision guide explains the important relationship
frequency density=frequencyclass width.\text{frequency density}=\frac{\text{frequency}}{\text{class width}}.frequency density=class widthfrequency.The formula is only one part of the skill. You must also recognise when a histogram is appropriate and remember that bar area represents frequency.
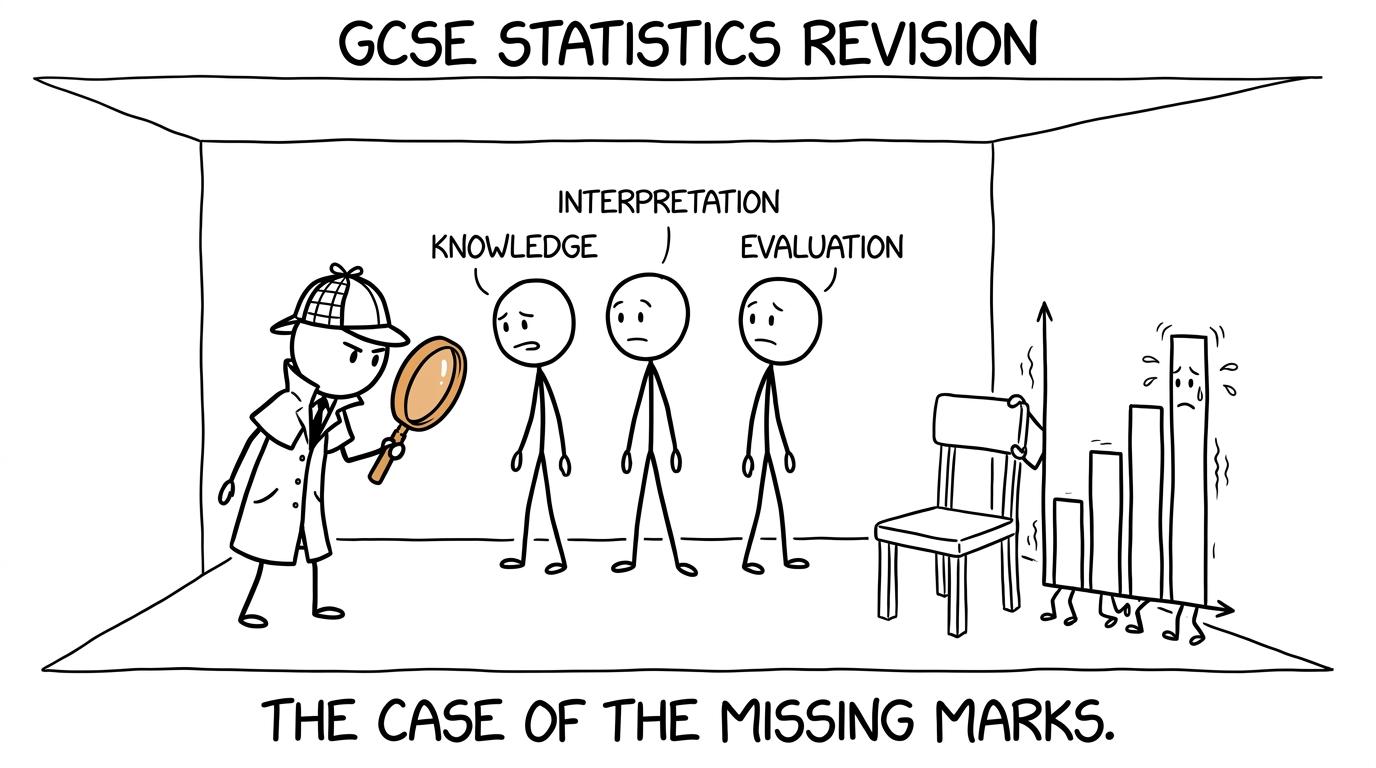 A statistics detective investigates the case of the missing marks
Common mistakes when interpreting a grade 4
Thinking grade 4 means every topic is secure
A grade is based on a total mark. Strong performance in some areas can compensate for weaker performance elsewhere. Use marked papers to identify your actual profile.
Calling grade 4 a failure because grade 5 is a strong pass
Grade 4 is a standard pass. Grade 5 is higher, but its description does not remove the recognised status of grade 4.
Treating grade 4 as exactly the old grade C
The official comparison aligns the lower boundaries. It is a reference point, not a complete one-to-one conversion of every result.
Assuming one percentage always guarantees the grade
Boundaries vary. Use several recent papers and their correct mark schemes rather than relying on an unofficial universal percentage.
Confusing GCSE Statistics with GCSE Maths
They are separate qualifications. A grade 4 in Statistics does not automatically satisfy an entry requirement that specifically asks for grade 4 or above in Maths.
Revising only calculations
Interpretation and evaluation carry substantial marks. Practise writing conclusions in context, identifying limitations and suggesting specific improvements to statistical investigations.
Make grade 4 a foundation, not a label
A grade 4 in GCSE Statistics means you crossed an important threshold. It shows credible statistical understanding at Level 2 and is broadly comparable at its lower boundary with the former grade C. It also leaves room to become more consistent, more precise and more confident.
Start on MathsGenie with the free GCSE Statistics revision hub. Use revision lessons to rebuild weak ideas, practice questions and mini tests to make them reliable, and past papers with mark schemes to learn what examiners reward. Near the exam, wider GCSE Maths students can also use predicted papers and video solutions to sharpen timing and technique.
The result is one number. Your next revision decision is more useful: find the next mark you can learn how to earn.