GCSE History State vs Private Results: What Data Shows
GCSE history state vs private results explained: see what 2025 sector data shows, why it cannot prove cause and how students should interpret it.
Results-day headlines often compress thousands of schools and millions of exam entries into one dramatic comparison. Private schools did better. State schools fell behind. The gap widened or narrowed.
But the GCSE history state vs private results question needs a more careful answer. The latest official England-wide data shows a substantial gap between independent and state-funded schools across all GCSE subjects combined. It does not, by itself, establish the size of the gap in GCSE History, explain why any difference exists, or predict the grade of an individual student.
That distinction matters. An average describes a group. It does not set a ceiling for you.
The short answer
Here is the most defensible reading of the available evidence:
- In England's summer 2025 results, independent schools had a considerably higher proportion of GCSE entries at grades 777 to 999 than state-funded schools across all subjects.
- The corresponding difference at grade 444 and above was also substantial.
- Those headline figures cover every GCSE subject combined, not GCSE History alone.
- A subject-specific comparison requires History entries to be filtered and weighted correctly.
- Even a reliable History comparison would show an association between school type and outcomes, not prove that the school sector caused the difference.
- School averages cannot tell you what grade a particular student will achieve.
The useful lesson is not to ignore the gap. It is to understand exactly what the numbers measure before deciding what they mean.
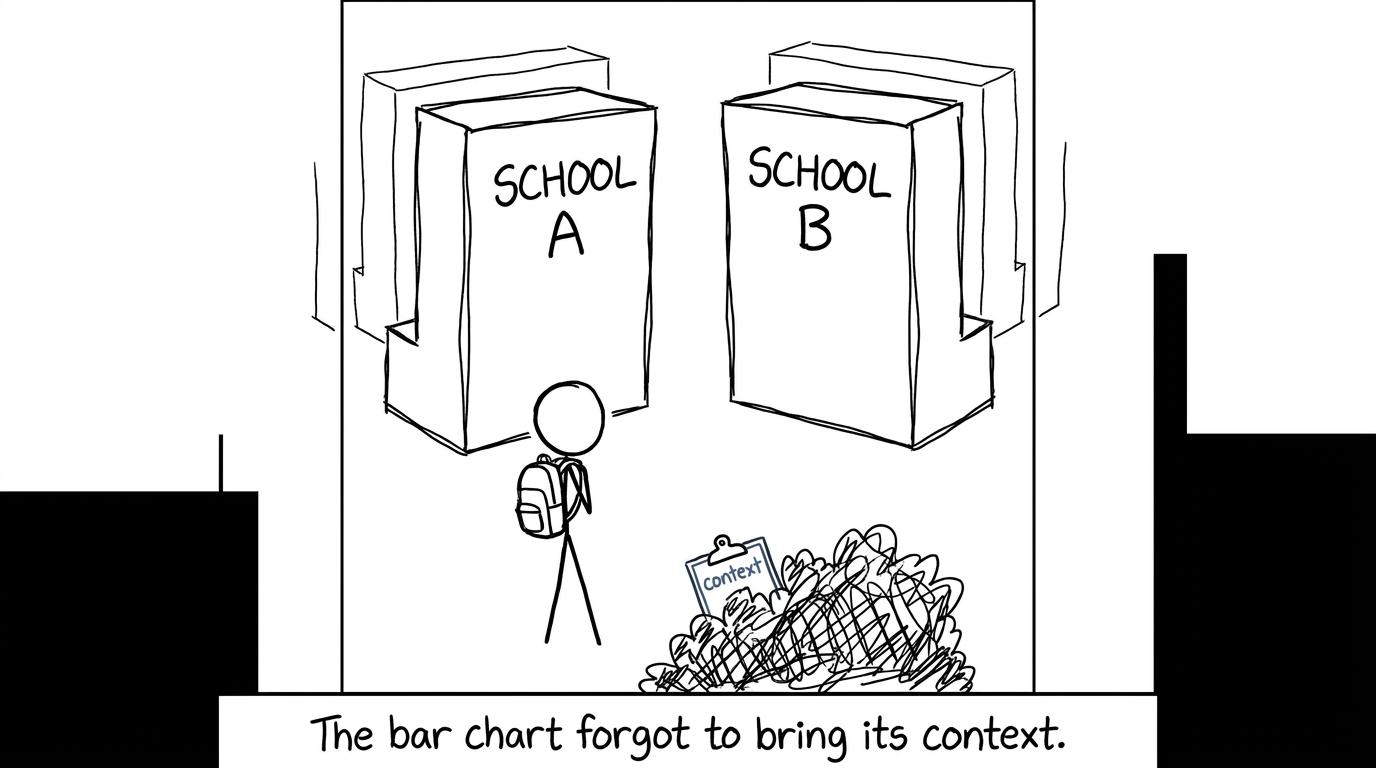 A school-results bar chart searching for its missing context
What the latest GCSE school-type data shows
Ofqual's official summer 2025 results for England reported outcomes by centre type. Across all GCSE subjects, 48.1%48.1\%48.1% of entries from independent schools received grade 777 or above. For all state-funded centres, the figure was 20.7%20.7\%20.7%.
The difference was therefore:
48.1%−20.7%=27.4 percentage points48.1\% - 20.7\% = 27.4\text{ percentage points}48.1%−20.7%=27.4 percentage pointsAt grade 444 and above, 89.6%89.6\%89.6% of independent-school entries reached the threshold, compared with 66.5%66.5\%66.5% across all state-funded centres. That is a gap of:
89.6%−66.5%=23.1 percentage points89.6\% - 66.5\% = 23.1\text{ percentage points}89.6%−66.5%=23.1 percentage pointsThese are large differences. At the top-grade threshold, the independent-school proportion was approximately:
48.120.7≈2.32\frac{48.1}{20.7} \approx 2.3220.748.1≈2.32times the state-funded proportion.
But percentage points and relative comparisons answer different questions. The first says how far apart the proportions are. The second describes one proportion relative to another. This is exactly the kind of distinction covered when revising GCSE Statistics.
There is another important detail. The state-funded total combines different types of centre, including academies, free schools, comprehensive schools, secondary modern schools and selective schools. In 2025, secondary selective schools recorded 63.2%63.2\%63.2% of entries at grade 777 or above, higher than the independent-school figure.
So even the label “state school” contains very different institutions. A private-versus-state headline can hide more variation than it reveals.
Does this prove that GCSE History grades differ by the same amount?
No. The figures above are for all GCSE subjects combined.
Ofqual provides interactive centre-type data that can be explored by subject, while the Department for Education publishes detailed subject-entry and grade data for schools in its Key Stage 4 datasets. Those sources make a History-focused investigation possible. However, the widely quoted 2025 headline table is not a GCSE History table.
It would therefore be misleading to take the overall 27.427.427.4 percentage-point top-grade gap and present it as the History gap. History may have a different entry profile, grade distribution and mixture of participating schools.
A sound History comparison would need to:
- include only GCSE History entries;
- use the same results year and geographical coverage;
- define “state” consistently;
- compare the same grade threshold;
- weight schools by their number of History entries rather than averaging school percentages equally;
- identify whether selective state schools are included;
- check whether every centre type has sufficient entries for a stable comparison.
This is why data interpretation is more than reading the tallest bar. Students taking GCSE Statistics can strengthen these skills through Edexcel GCSE Statistics revision, including lessons, questions and past papers.
What the data does not tell you
It does not establish cause
Suppose two sectors have different average results. That does not mean school type alone produced the difference.
The groups may differ in prior attainment, admissions, family circumstances, geography, access to resources, cohort composition and the proportion of pupils entered for a subject. Some independent schools are academically selective; some are not. Some state schools are selective; most are not.
A descriptive table normally does not hold all those factors constant. The result is an association, not a controlled experiment.
To estimate a school-sector effect, researchers would need to compare otherwise similar pupils and account carefully for relevant background characteristics. Even then, conclusions would depend on the quality of the data and the assumptions used.
It does not compare identical schools
“Independent school” and “state-funded school” are administrative categories, not descriptions of one standard learning environment. Schools within either group can differ in size, admissions, curriculum, location and pupil intake.
Variation within a sector may be substantial. A national average can be accurate while still being a poor description of a particular school.
It does not measure individual potential
If 20.7%20.7\%20.7% of entries across a broad category achieved grade 777 or above, that does not mean a student in that category has a fixed 20.7%20.7\%20.7% chance of earning a top grade.
The percentage is a retrospective group outcome. It is not a personal probability model incorporating your current knowledge, attendance, revision, exam technique or performance on timed papers.
This is the quiet danger of averages: they can feel personal when they are not.
Why GCSE History results can be difficult to compare
GCSE History is assessed by several exam boards, including AQA, Pearson Edexcel, OCR and Eduqas. The specifications differ in their paper structures and optional historical topics, although regulated GCSE assessment objectives cover knowledge, explanation, analysis, sources and interpretations.
Schools may choose different specifications and topic combinations. Entry patterns can also vary between schools because History is not taken by every GCSE pupil.
That creates several comparison problems:
- one sector may have a different proportion of pupils entered for History;
- schools may use different exam boards and options;
- small cohorts can produce volatile percentages;
- grade boundaries vary by exam series and specification;
- comparing raw marks across different specifications would not be meaningful without appropriate standardisation.
Grades are designed to communicate attainment within a qualification. They are not a simple universal raw-mark scale shared by every History paper.
How students should respond to school-sector statistics
The mature response is neither denial nor defeat.
There are real inequalities in aggregate educational outcomes, and the official data should not be softened into meaninglessness. Yet the national comparison is not a revision strategy. It cannot tell you which topic you forgot, why you lost a method mark or what to do this evening.
For maths revision, replace distant averages with evidence you can act on:
- complete a timed paper or mini test;
- mark it accurately using the mark scheme;
- separate knowledge gaps from arithmetic and reading errors;
- choose the two or three topics costing the most marks;
- use a revision lesson and targeted questions;
- test the same skills again without notes.
The GCSE one-week maths revision plan gives this process a manageable structure. If you take Edexcel, the guide to using GCSE Maths past papers properly explains how to turn each paper into specific next steps.
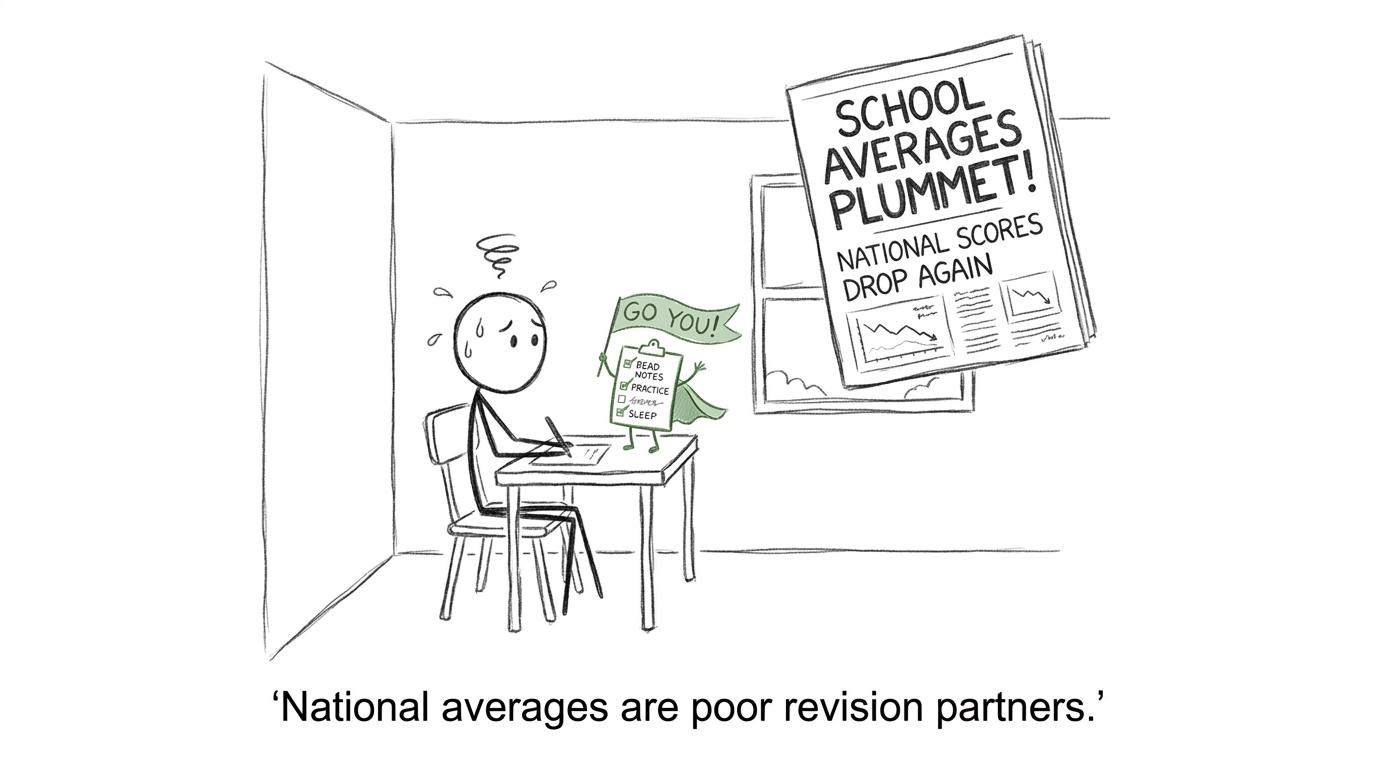 A revision checklist proves more useful than a newspaper average
Common mistakes when reading GCSE results data
Treating entries as pupils
Official results tables often report the percentage of exam entries receiving particular grades. A pupil taking several GCSEs contributes several entries. Saying that the same percentage of pupils achieved the threshold may therefore be inaccurate.
Confusing percentage points with per cent change
A rise from 20%20\%20% to 25%25\%25% is an increase of 555 percentage points. Relative to the original value, it is a 25%25\%25% increase:
25−2020×100%=25%\frac{25-20}{20}\times 100\% = 25\%2025−20×100%=25%The two descriptions are not interchangeable.
Calling the all-subject gap the History gap
An overall sector table cannot automatically answer a subject-specific question. Always check the subject filter, year, country, grade threshold and centre classification.
Assuming correlation proves causation
A difference between groups does not identify which factors produced it. Strong claims require analysis that accounts for plausible alternative explanations.
Letting an average become a prediction
A national result can provide context, but your marked work provides better revision evidence. Use the MathsGenie guide to finding your weakest topics to turn mistakes into a focused plan.
The conclusion that is useful
The latest official data shows a clear overall GCSE attainment gap between independent and state-funded schools in England, particularly at grades 777 to 999. It also shows that selective state schools complicate any simple state-versus-private story.
What the headline data does not support is an unqualified claim that GCSE History has exactly the same gap, that the school sector alone caused the difference, or that a student's school type determines their result.
Good data interpretation preserves both truths: group differences can matter, and individuals are not averages.
For the part you can influence now, make MathsGenie your free revision base. Start with free GCSE and A Level maths revision, use revision lessons and practice questions to repair weak topics, then test your progress with GCSE predicted papers, past papers, mini tests, mark schemes and video solutions. Read the national statistics carefully, but let your own marked work decide what you practise next.