GCSE Further Maths State vs Private Results
GCSE further maths state vs private results: see what 2025 data reveals, why comparisons can mislead, and how students can focus revision effectively.
A school label can feel strangely powerful. When results tables show independent schools near the top, it is easy to assume that the name above the school gate has already decided what will happen on results day.
The gcse further maths state vs private results question has a more careful answer. Independent schools achieve more top grades across GCSE subjects overall, but the main published figures do not provide a clean, like-for-like national comparison specifically for Further Maths. The available Further Maths results are strong, yet they describe a highly selected group of candidates rather than proving that one school type teaches the subject better.
For students, that distinction matters. Statistics can describe a cohort. They cannot set your grade.
The answer at a glance
- In England in summer 202520252025, 48.1%48.1\%48.1% of GCSE results from independent schools were at grade 777 or above, compared with 20.7%20.7\%20.7% across all state-funded centres.
- Those figures cover all GCSE subjects combined, not Further Maths alone.
- AQA reported 35,28935,28935,289 entries for its Level 2 Certificate in Further Mathematics in June 202520252025.
- Across that selected AQA cohort, 57.4%57.4\%57.4% achieved grade 777 or above and 22.0%22.0\%22.0% achieved grade 999.
- AQA's qualification is formally a Level 2 Certificate, although students and schools commonly call it GCSE Further Maths.
- The published headline data does not show that attending a private school causes a higher Further Maths grade.
- Your most useful response is to concentrate on specification knowledge, deliberate practice and accurate feedback.
Students taking the AQA qualification can begin with the free AQA GCSE Further Maths revision hub, where lessons, questions and past papers are organised in one place.
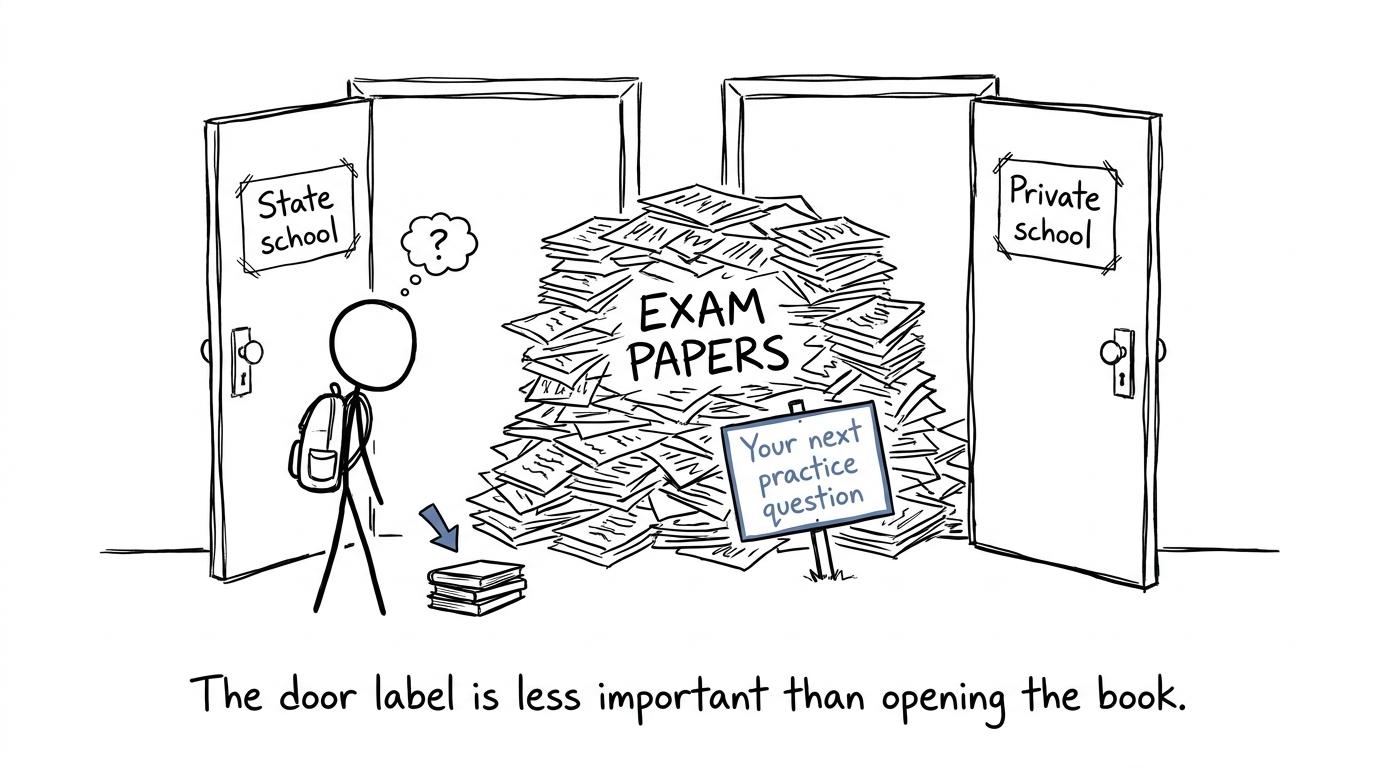 A student discovers that both school doors lead to the same pile of exam papers
What the latest results data actually shows
Two sets of official figures are relevant, but they answer different questions.
Ofqual's summer 202520252025 statistics compare GCSE outcomes by centre type in England. AQA separately publishes national outcomes for its Level 2 Certificate in Further Mathematics. Placing the figures side by side is informative, provided we do not pretend they measure the same population.
| Measure | State-funded centres | Independent schools | AQA Further Maths cohort |
|---|---|---|---|
| Grade 777 or above | 20.7%20.7\%20.7% | 48.1%48.1\%48.1% | 57.4%57.4\%57.4% |
| Grade 444 or above | 66.5%66.5\%66.5% | 89.6%89.6\%89.6% | 90.8%90.8\%90.8% |
| Scope | All GCSE subjects | All GCSE subjects | AQA Level 2 Further Mathematics |
The independent-school figures use Ofqual's category of independent schools, including city training colleges. The state-funded total combines several centre types. It therefore hides substantial variation between comprehensive schools, academies, free schools and selective state schools.
For all GCSE subjects combined, the difference at grade 777 or above was:
48.1%−20.7%=27.4 percentage points48.1\% - 20.7\% = 27.4\text{ percentage points}48.1%−20.7%=27.4 percentage pointsThat is a sizeable descriptive gap. It is not, however, a Further Maths gap. Nor is it evidence that changing school type would automatically change an individual result by a particular amount.
Why Further Maths results look unusually high
The AQA Further Maths cohort achieved notably high grades in 202520252025: 40.9%40.9\%40.9% received grade 888 or above, while 57.4%57.4\%57.4% received grade 777 or above. These figures make more sense once we ask who takes the qualification.
Level 2 Further Mathematics extends GCSE content through areas including algebra, coordinate geometry, calculus, matrix transformations and geometry. Schools generally offer it to students who are already confident with higher-tier GCSE Maths. Some schools do not offer it at all, while others use prior attainment, class sets or teacher recommendations when deciding entries.
This creates selection effects. The candidates are not a random sample of all Year 111111 students. They are disproportionately students who have already demonstrated mathematical strength and who attend a school able to provide the course.
Consequently, the statement "57.4%57.4\%57.4% achieved grade 777 or above" means:
Of the students entered for this particular AQA qualification in June 202520252025, 57.4%57.4\%57.4% received at least grade 777.
It does not mean that 57.4%57.4\%57.4% of all GCSE students could expect that outcome, or that Further Maths is easier than ordinary GCSE Maths.
Why a state versus private comparison is difficult
A fair comparison needs comparable students, comparable entry policies and comparable qualifications. The headline statistics do not provide all three.
Access to the course differs
A school needs timetable space, suitable teaching expertise and enough interested students to run Further Maths. Provision can vary within both sectors. A large state school may have a substantial programme, while another school may not enter any candidates. The same variation can exist among independent schools.
If one sector enters a larger proportion of already high-attaining mathematicians, its average result may rise even if the quality of teaching is otherwise similar.
School populations are different
Results are associated with many overlapping factors: prior attainment, selection at admission, family circumstances, attendance, additional tuition, available curriculum time and peer groups. Selective state schools also demonstrate why a simple state-private label can conceal more than it reveals.
A result table records the final grades. It does not isolate the effect of each factor.
The qualification label can be confusing
"GCSE Further Maths" is a useful everyday phrase, but AQA's course is the Level 2 Certificate in Further Mathematics. Other awarding organisations offer different additional mathematics qualifications, with different specifications and grading systems.
Students should therefore confirm the exact qualification and specification with their teacher rather than assuming that every Further Maths result belongs in one national GCSE table. The GCSE Maths revision hub also lets students select their board, including Edexcel, AQA, OCR and Eduqas, for their main GCSE Maths course.
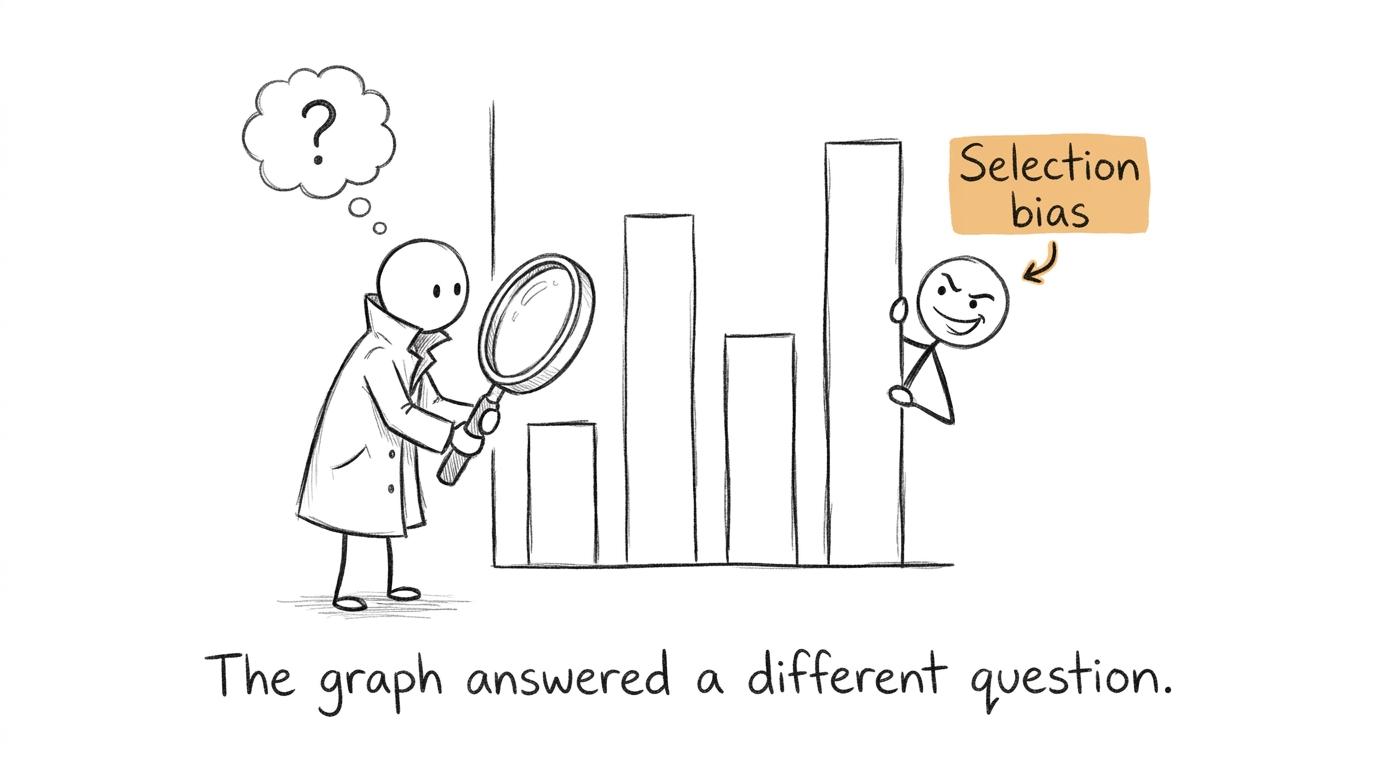 A data detective notices selection bias hiding behind a results chart
What the data does not tell you
The figures do not tell us that private-school teaching alone caused the higher overall GCSE outcomes. This would require analysis controlling for meaningful differences between students before they entered the course.
They also do not reveal:
- how many schools in each sector offered the qualification;
- how students were selected for entry;
- how much curriculum or after-school time was provided;
- candidates' earlier GCSE Maths attainment;
- whether tutoring or other support was used;
- how outcomes compare for otherwise similar students.
This is the difference between correlation and causation. School type and results are associated in the overall GCSE figures, but an association does not identify one isolated cause.
There is another limitation: national percentages cannot predict an individual's grade. A cohort percentage is an average across thousands of entries. Your paper is marked from the work you submit, using the same assessment criteria and grade boundaries for that qualification regardless of your school's funding model.
What matters more for your own grade
You cannot revise a national statistic. You can revise algebra, graphs, matrices and calculus.
A strong plan begins with a diagnostic paper. Attempt it under suitable conditions, mark it honestly and record why each mark was lost. The guide to using GCSE past papers properly explains how to turn a score into a practical repair list rather than treating the paper as a final judgement.
Classify mistakes into four useful groups:
- Knowledge: you did not know the required fact or method.
- Choice: you knew several methods but selected an unsuitable one.
- Accuracy: the approach was sound, but algebra or arithmetic failed.
- Communication: working, notation or justification was insufficient.
Then focus on the smallest skill that caused the problem. MathsGenie's guide to finding your weakest GCSE topics can help you prioritise evidence rather than revising whichever chapter feels most comfortable.
A reliable cycle is:
- learn one method through a revision lesson;
- practise it with focused questions;
- check your work using solutions or a mark scheme;
- write one specific correction;
- retest the skill later with a different question;
- move into mixed and timed papers once the method is secure.
This approach is available to students in any school. If your ordinary GCSE algebra needs strengthening first, the AQA GCSE Maths revision page provides foundation and higher-tier materials. The broader guide to revising GCSE Maths efficiently can help you build a sustainable weekly routine.
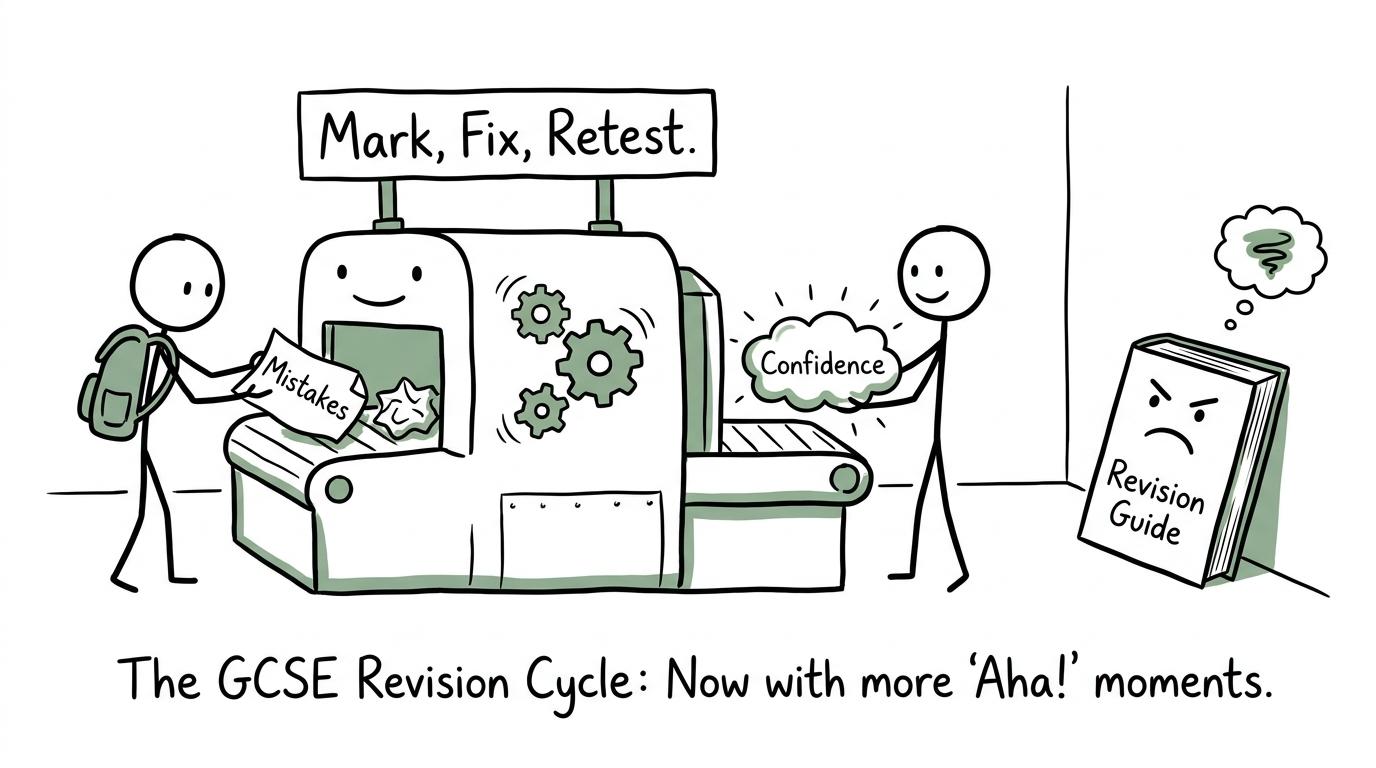 A revision machine turns marked mistakes into confidence
Common mistakes when interpreting school results
Comparing percentages with different denominators
The overall state and independent percentages include results across all GCSE subjects. The AQA Further Maths percentage includes only candidates entered for that qualification. Comparing them as though they describe identical groups produces a misleading conclusion.
Treating correlation as proof of cause
A higher result for one centre type does not prove that fees, buildings or the school label caused it. Selection, prior attainment and access to the course may all influence the pattern.
Assuming every state school is alike
The state-funded category contains schools with very different admissions, populations and resources. A national average cannot describe every classroom.
Reading a high pass rate as an easy examination
Further Maths entrants are usually mathematically confident before beginning the course. Strong cohort outcomes can reflect who was entered, not low assessment demand.
Letting statistics lower expectations
The most damaging mistake is turning a population average into a personal ceiling. Results tables describe what happened to groups in the past. They do not award the marks on your next paper.
The result that remains under your control
The honest conclusion is not that school type is irrelevant. Access, teaching time and support can matter. It is that the available headline data cannot isolate those effects specifically for Further Maths, and it cannot determine your individual outcome.
What it can show is that Further Maths candidates are a selected, high-attaining group and that overall GCSE top-grade rates differ substantially between centre types. Beyond that, careful interpretation is essential.
Your next move should be practical. Open the AQA Further Maths revision resources, identify one weak topic and complete a focused set of questions. Mark it. Fix it. Retest it. As the exams approach, add past papers, mark schemes, video solutions and appropriate predicted papers to your revision planner.
If Further Maths is preparing you for what comes next, you can also explore the free A Level Further Maths revision hub. Wherever you go to school, MathsGenie gives you the same valuable starting point: clear lessons, purposeful practice and honest feedback.