GCSE Food and Nutrition Grade 9 Rate Explained
GCSE Food and Nutrition grade 9 rate data explained, with the latest exam-board figures, annual trends and comparisons with other GCSE results.
A grade 9 can feel strangely mysterious. You know it is the highest GCSE grade, but that does not tell you whether it is achieved by one student in ten, one in fifty, or almost nobody at all.
The latest GCSE Food and Nutrition grade 9 rate data gives a reassuringly clear answer: in the 2025 results published by the major exam boards, roughly 3.4%3.4\%3.4% to 5.5%5.5\%5.5% of candidates achieved a grade 9. In everyday terms, that is approximately one student in every 181818 to 292929, depending on the exam board.
The rate changes each year and is not identical across AQA, OCR and Eduqas. It is also important not to confuse the grade 9 rate with the much larger percentage achieving grade 7 or above.
The grade 9 rate at a glance
Here is the short version of what the latest authoritative results statistics show:
- AQA reported a 2025 grade 9 rate of 4.7%4.7\%4.7%.
- OCR reported a 2025 grade 9 rate of 5.5%5.5\%5.5%.
- Eduqas reported a 2025 grade 9 rate of 3.4%3.4\%3.4%.
- Across these major boards, a sensible headline description is around 4%4\%4% to 5%5\%5%.
- The overall 2025 grade 9 rate across all GCSE subjects in England was approximately 5.1%5.1\%5.1%.
- Food Preparation and Nutrition therefore sat around, or slightly below, the all-subject figure depending on the board.
These are percentages of candidates receiving a grade 9, not the percentage of available marks needed. Grade boundaries are a separate issue and are set after the assessments have been marked.
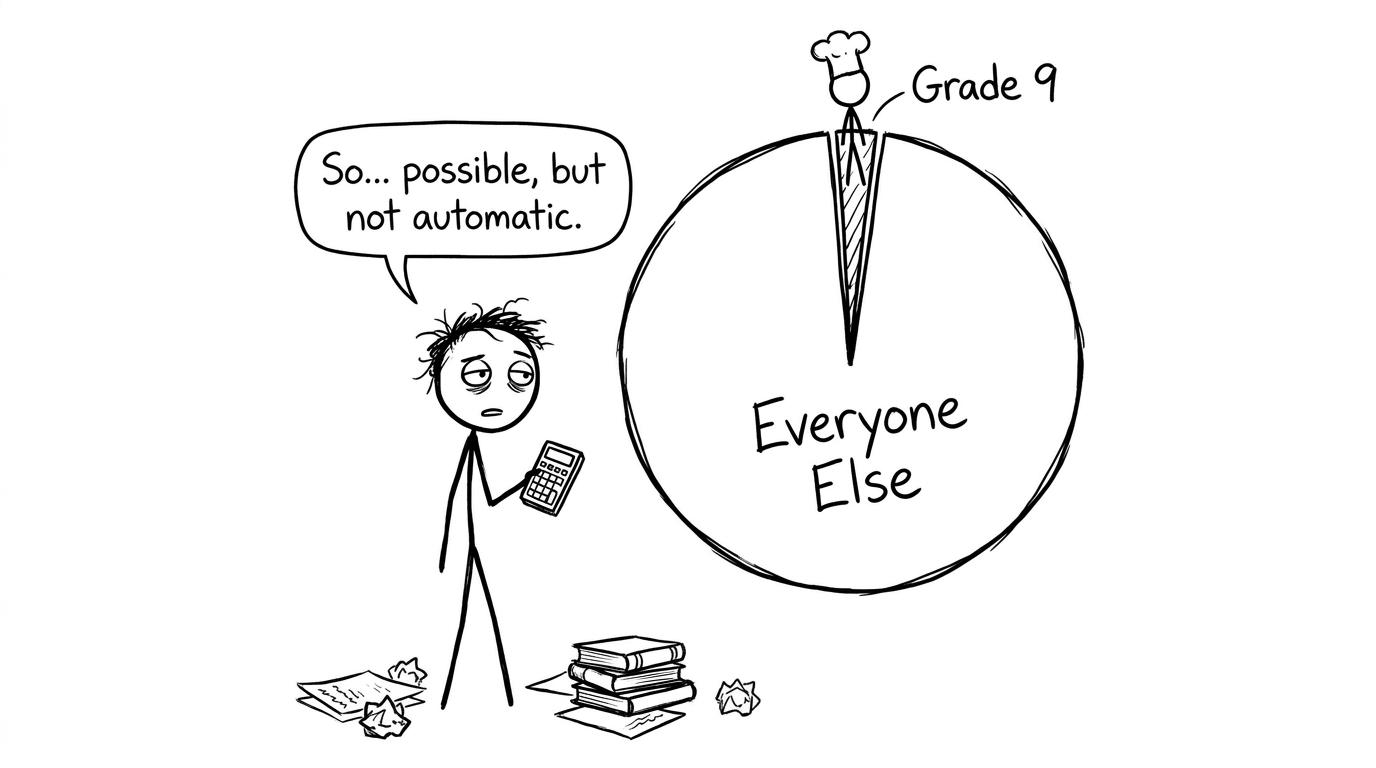 A student tries to interpret a very small grade 9 slice of an exam-results pie chart
Latest GCSE Food and Nutrition grade 9 rate
The latest complete published summer results available at the time of writing are from 2025. The official exam-board statistics are cumulative, meaning the grade 9 column represents the percentage achieving grade 9 itself, while later columns may represent a stated grade or higher.
| Exam board | 2024 grade 9 rate | 2025 grade 9 rate | 2025 candidates |
|---|---|---|---|
| AQA | 4.3%4.3\%4.3% | 4.7%4.7\%4.7% | 32,34332,34332,343 |
| OCR | approximately 5.0%5.0\%5.0% | 5.5%5.5\%5.5% | 4,5924,5924,592 |
| Eduqas | not used here because a comparable figure was not confirmed in the research | 3.4%3.4\%3.4% | 18,46918,46918,469 |
The data comes from the official summer results statistics published by AQA, OCR and Eduqas. JCQ also reported 59,98759,98759,987 UK entries for Food Preparation and Nutrition in 2025, with 21.3%21.3\%21.3% receiving grade 7 or above and 68.6%68.6\%68.6% receiving grade 4 or above.
Those figures reveal something useful. Grade 9 is rare, but high grades more generally are not vanishingly rare. About one candidate in five achieved at least grade 7 across the UK in 2025.
Why there is no single permanent grade 9 percentage
Students often search for one national figure and expect it to behave like a fixed ingredient in a recipe. Exam statistics do not work that way.
The percentage changes because the candidates, assessments and grade boundaries change. AQA, OCR and Eduqas also have different groups of entrants. Comparing their percentages does not prove that one paper was easier or that one board offers a better chance of a grade 9.
Exam boards use statistical evidence and expert judgement when setting grade boundaries. Boundaries can move so that standards are maintained when a paper is more or less demanding than expected. A grade 9 rate is therefore an outcome from a particular exam series, not a target fixed before every student sits the paper.
There is another complication: headline UK data may combine qualifications and jurisdictions whose grading arrangements are not perfectly identical. For the cleanest grade 9 comparison, use the results statistics for your own specification and exam board.
How Food and Nutrition compares with other GCSEs
Across all GCSE subjects in England, approximately 5.1%5.1\%5.1% of grades awarded in 2025 were grade 9s. The Food Preparation and Nutrition figures from the major boards ranged from 3.4%3.4\%3.4% to 5.5%5.5\%5.5%. That puts the subject broadly in the same statistical neighbourhood as the overall GCSE rate, although the Eduqas result was lower and the OCR result slightly higher.
This does not mean Food and Nutrition is objectively easier or harder than GCSE Maths, English, biology or French. Subject comparisons are affected by who enters each qualification. Separate sciences, modern languages and optional creative subjects can have very different candidate populations.
The same warning applies when comparing Food and Nutrition with GCSE Maths. Maths is normally taken by an extremely broad cohort, while Food Preparation and Nutrition is an option chosen by a much smaller group. Raw percentages describe outcomes; they do not explain every cause behind them.
If you enjoy understanding how percentages can clarify or distort a story, the GCSE Statistics revision hub develops exactly that habit. The statistical skills revision guide is also useful for recognising weak comparisons, missing context and misleading claims.
What the percentage means mathematically
A grade rate is calculated using:
Grade 9 rate=number receiving grade 9number of candidates×100\text{Grade 9 rate}=\frac{\text{number receiving grade 9}}{\text{number of candidates}}\times 100Grade 9 rate=number of candidatesnumber receiving grade 9×100The important word is rate. A large exam board can award more grade 9s in total while having a lower percentage than a smaller board. Counts and percentages answer different questions.
It is also sensible to translate percentages into approximate frequencies:
- 5%5\%5% is about one in 202020.
- 4%4\%4% is about one in 252525.
- 3.4%3.4\%3.4% is about one in 292929.
- 5.5%5.5\%5.5% is about one in 181818.
These are rounded interpretations, not exact predictions for a classroom or school. A group of 202020 students is not guaranteed to contain exactly one grade 9 candidate.
For students who want to strengthen the underlying skill, MathsGenie's GCSE Maths revision hub brings together percentages, fractions, ratio, statistics and exam questions. You can also revisit how numerical summaries work through the averages revision guide.
What a grade 9 demands
National grade descriptors indicate that the strongest candidates demonstrate comprehensive knowledge, apply it accurately and evaluate food-related information with well-reasoned conclusions. They also plan, prepare and present food with a high level of technical skill.
That breadth matters because the qualification is not simply a cooking test. Across AQA, OCR and Eduqas, the written examination contributes 50%50\%50% of the GCSE and non-exam assessment contributes the other 50%50\%50%. Exact timings and task structures vary by specification, so students should check their own board's requirements.
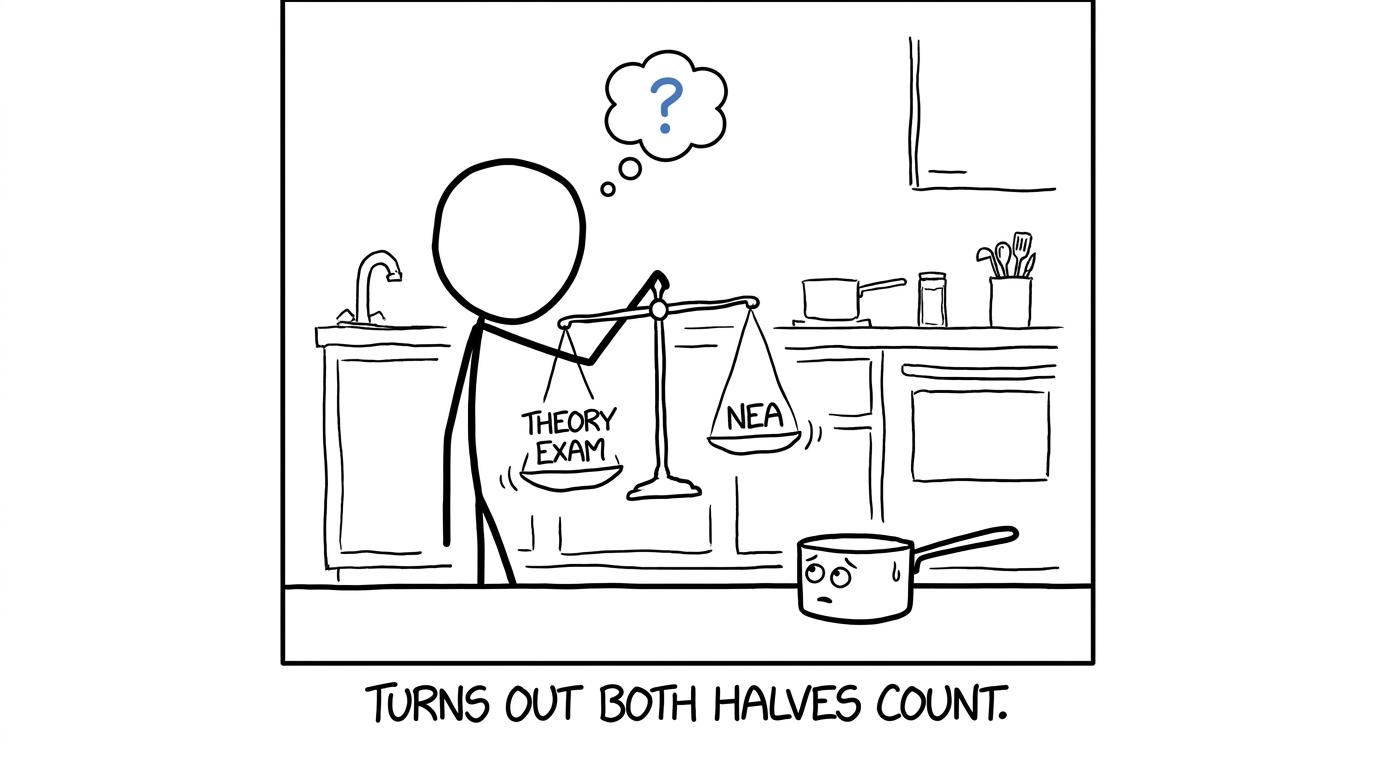 A student balances theory and non-exam assessment while a saucepan watches nervously
AQA, for example, assesses areas including nutrition and health, food science, food safety, food choice and food provenance. OCR and Eduqas organise their content differently, but both combine theoretical understanding with food investigation and preparation.
A strong revision checklist should therefore include:
- knowing the specification rather than revising from memory alone;
- retrieving precise scientific and nutritional terminology;
- applying knowledge to unfamiliar foods and situations;
- analysing results rather than merely describing them;
- evaluating choices with specific evidence;
- checking NEA work against the permitted teacher guidance;
- practising written questions under realistic time limits.
Use the rate as context, not a prediction
A national percentage cannot calculate your personal probability of achieving a grade 9. It does not know your current knowledge, NEA performance, revision routine or response to feedback.
The healthier interpretation is this: grade 9 is uncommon because it requires consistently excellent evidence across the course, but thousands of candidates achieve it. The statistic describes the size of the achievement. It does not place a ceiling on an individual student.
This principle carries directly into maths revision. A target grade becomes more useful when it is converted into actions: diagnose a weak topic, learn the method, answer questions, mark them and repeat the questions that exposed a gap. The best order for learning GCSE Maths topics offers a structured route, while the one-month GCSE Maths revision plan turns that route into a weekly routine.
 The revision folder that practises, marks and fixes mistakes overtakes the folder that only rereads notes
Common mistakes when reading grade statistics
Confusing grade 9 with grades 9 to 7
A figure such as 21.3%21.3\%21.3% at grade 7 and above includes grades 7, 8 and 9. It is not the grade 9 rate. In 2025, the grade 9 percentage was much smaller.
Treating a percentage as a grade boundary
A grade 9 rate tells you how many candidates received the grade. A grade boundary tells you the minimum mark required in that exam series. The two measures are related to the same results but are not interchangeable.
Comparing boards without considering their candidates
A difference of a few percentage points may reflect cohort composition, entry patterns or normal annual variation. It does not establish that one specification is easier.
Assuming last year's boundary will be repeated
Past boundaries are useful context, not promises. Revise the whole specification and aim comfortably above an old boundary rather than treating it as an exact future target.
Letting rarity become discouragement
Around one in 202020 is selective, but it is not impossible. Concentrate on work you can control rather than trying to reverse-engineer the performance of every other candidate.
Turn statistics into a better revision decision
The most valuable fact is not that only a small share of students earn grade 9. It is that top performance is built from many ordinary, repeatable decisions: accurate recall, careful application, honest marking and quick correction.
Use the same approach for your maths exams. Begin at the GCSE Maths revision hub, then combine revision lessons with practice questions, mini tests, video solutions and mark schemes. As the exams approach, follow the GCSE past-paper strategy and add predicted papers once your topic knowledge is secure.
A grade statistic tells you what happened nationally. MathsGenie helps you decide what to do next, for free, one topic and one corrected mistake at a time.