GCSE Chemistry Gender Gap Results: 2025 Data
GCSE chemistry gender gap results explained using 2025 national data, careful comparisons and practical lessons for confident GCSE maths revision.
It is easy to see a headline about boys, girls and exam grades and quietly wonder what it predicts about you. Usually, much less than it seems. The latest GCSE chemistry gender gap results show that outcomes for male and female entries in separate GCSE Chemistry were remarkably close in England in 2025. Female entries were slightly more likely to receive grade 777 or above, while the difference at grade 444 or above was effectively negligible.
That is the short answer. The more useful answer is about how we read the data and why a national average should never become a personal ceiling.
The national data at a glance
The following checklist captures what matters most:
- In England, there were 161,948161{,}948161,948 GCSE Chemistry results in the 2025 JCQ data.
- Female entries had a small lead at grade 777 or above: approximately 46.3%46.3\%46.3% compared with 45.9%45.9\%45.9% for male entries.
- At grade 444 or above, both groups recorded approximately 91.5%91.5\%91.5%.
- Male entries had a very small lead at grade 999: approximately 2.9%2.9\%2.9% compared with 2.8%2.8\%2.8%.
- These figures concern separate GCSE Chemistry, not Combined Science.
- The official tables classify results by recorded sex, using male and female categories. That is narrower than the full meaning of gender.
- A difference between group outcomes does not explain what caused it and does not predict an individual student’s grade.
The data comes from the Joint Council for Qualifications’ summer 2025 results tables. JCQ reports results across England, Wales and Northern Ireland, but qualifications and grading arrangements differ between nations. For the clearest comparison, the figures below use England only.
| 2025 GCSE Chemistry outcome in England | Female entries | Male entries | Difference |
|---|---|---|---|
| Grade 999 | About 2.8%2.8\%2.8% | About 2.9%2.9\%2.9% | Male lead of about 0.10.10.1 percentage points |
| Grade 777 or above | About 46.3%46.3\%46.3% | About 45.9%45.9\%45.9% | Female lead of about 0.50.50.5 percentage points |
| Grade 444 or above | About 91.5%91.5\%91.5% | About 91.6%91.6\%91.6% | Male lead of about 0.030.030.03 percentage points |
Rounded values are useful for seeing the pattern, but they should not be made to sound more dramatic than they are. At grade 444 or above, the difference is only a few hundredths of a percentage point.
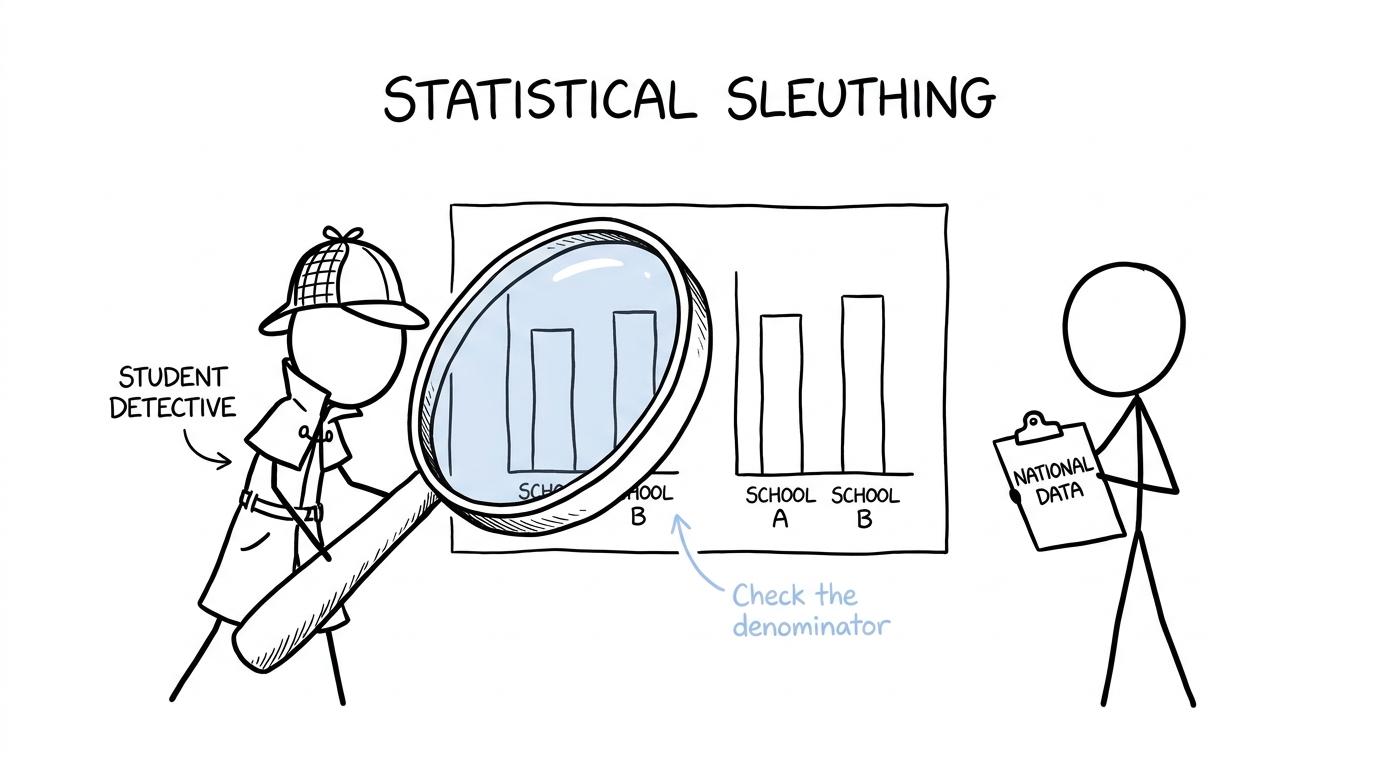 A student detective checks the denominator in national exam data
Is there a gender gap in GCSE Chemistry results?
There is a small difference at some grade thresholds, but there is no large, consistent advantage across the whole grade distribution.
At grade 777 or above, female entries were ahead by approximately:
46.3%−45.9%=0.4 percentage points46.3\% - 45.9\% = 0.4\text{ percentage points}46.3%−45.9%=0.4 percentage pointsUsing the unrounded JCQ data gives a gap of roughly 0.50.50.5 percentage points. At grade 444 or above, the two rates were almost identical. At grade 999, male entries held a similarly small lead.
This matters because the phrase “gender gap” can suggest one simple, fixed difference. The actual distribution is more balanced. Which group appears ahead depends partly on the grade threshold selected.
It also changed from 2024. JCQ’s 2024 England figures showed approximately 45.5%45.5\%45.5% of female Chemistry entries and 44.0%44.0\%44.0% of male entries achieving grade 777 or above. The top-grade gap therefore narrowed substantially in 2025 as outcomes rose more sharply for male entries.
One year does not establish a permanent trend. Results can shift because the cohort changes, entry patterns change and different students take separate sciences rather than Combined Science. Ofqual specifically noted that the 2025 increase in high grades across the individual sciences may partly reflect changes in the composition of entries.
What the figures measure and what they do not
National results tables count entries and awarded grades. They do not measure natural ability, effort, confidence or future potential.
That distinction is easy to miss. Suppose one group has a higher proportion of entries at a threshold. The data tells us:
threshold rate=entries at or above the gradetotal entries in the group×100\text{threshold rate} = \frac{\text{entries at or above the grade}}{\text{total entries in the group}} \times 100threshold rate=total entries in the groupentries at or above the grade×100It does not tell us why that proportion occurred.
Possible influences may include prior attainment, school provision, subject-entry policies, attendance, socioeconomic circumstances and revision opportunities. The published outcome table does not isolate these factors, so it cannot prove that any one of them caused the difference.
The denominator matters too. In the England data, there were 78,76778{,}76778,767 female entries and approximately 83,18183{,}18183,181 male entries. Comparing raw numbers of top grades would therefore be misleading because the group sizes were different. Percentages allow a fairer comparison.
These are precisely the habits developed through GCSE statistics: identify the population, inspect the denominator and avoid claiming causation from an association. MathsGenie’s free GCSE Statistics revision hub brings together lessons, questions, worksheets and past papers for strengthening those skills.
Why this matters for GCSE maths revision
Chemistry results may seem distant from your next maths paper. Yet interpreting them draws on several examinable ideas: percentages, charts, averages, sampling and cautious conclusions.
Percentage points are not percentage change
A movement from 45%45\%45% to 46%46\%46% is an increase of 111 percentage point. Its relative percentage increase is:
46−4545×100%≈2.2%\frac{46-45}{45}\times 100\% \approx 2.2\%4546−45×100%≈2.2%Those statements describe the same movement in different ways. News reports often use “per cent” when they mean “percentage points”, making a modest gap sound larger or less precise.
For targeted support, begin with the GCSE Maths revision hub, where you can select Edexcel, AQA, OCR, Eduqas and other exam-board resources matched to foundation or higher tier.
Thresholds hide the full distribution
“Grade 777 or above” combines grades 777, 888 and 999. It cannot show how results are distributed within that range. Likewise, a grade 444 threshold does not tell us whether most students received grade 444, grade 666 or grade 999.
One summary statistic rarely tells the whole story. The same principle appears when comparing a mean, median and range. The averages revision guide explains what each measure reveals and what it can conceal.
Correlation is not causation
A relationship between two variables does not prove that one causes the other. Here, knowing a candidate’s recorded sex gives very little information about the grade that individual will achieve. There is enormous overlap between the two groups.
When revising this distinction, use the scatter graphs revision guide before attempting the accompanying scatter graph practice questions. The goal is not merely to spot a pattern, but to describe it without claiming more than the evidence supports.
 A chemistry flask faces a calculator in a data-skills interview
How students should respond to the data
National outcomes provide context, not instructions. You cannot revise a national average. You can revise percentages, algebra, graphs or whichever topic is currently losing you marks.
A practical response is to:
- identify your exam board and tier;
- complete a short set of mixed questions;
- mark it carefully using the mark scheme;
- record the exact reason for each lost mark;
- revisit the weakest skill using a revision lesson;
- answer fresh practice questions without notes;
- test the skill again several days later.
This process replaces comparison with evidence. A student sitting below a national average today is not trapped there; a student sitting above it is not guaranteed to remain there. Both still need deliberate practice.
If a full revision timetable feels overwhelming, use the GCSE one-month maths revision plan to turn broad intentions into short, measurable sessions. MathsGenie’s topic lessons, mini tests and video solutions make it easier to act on a weakness instead of simply labelling it.
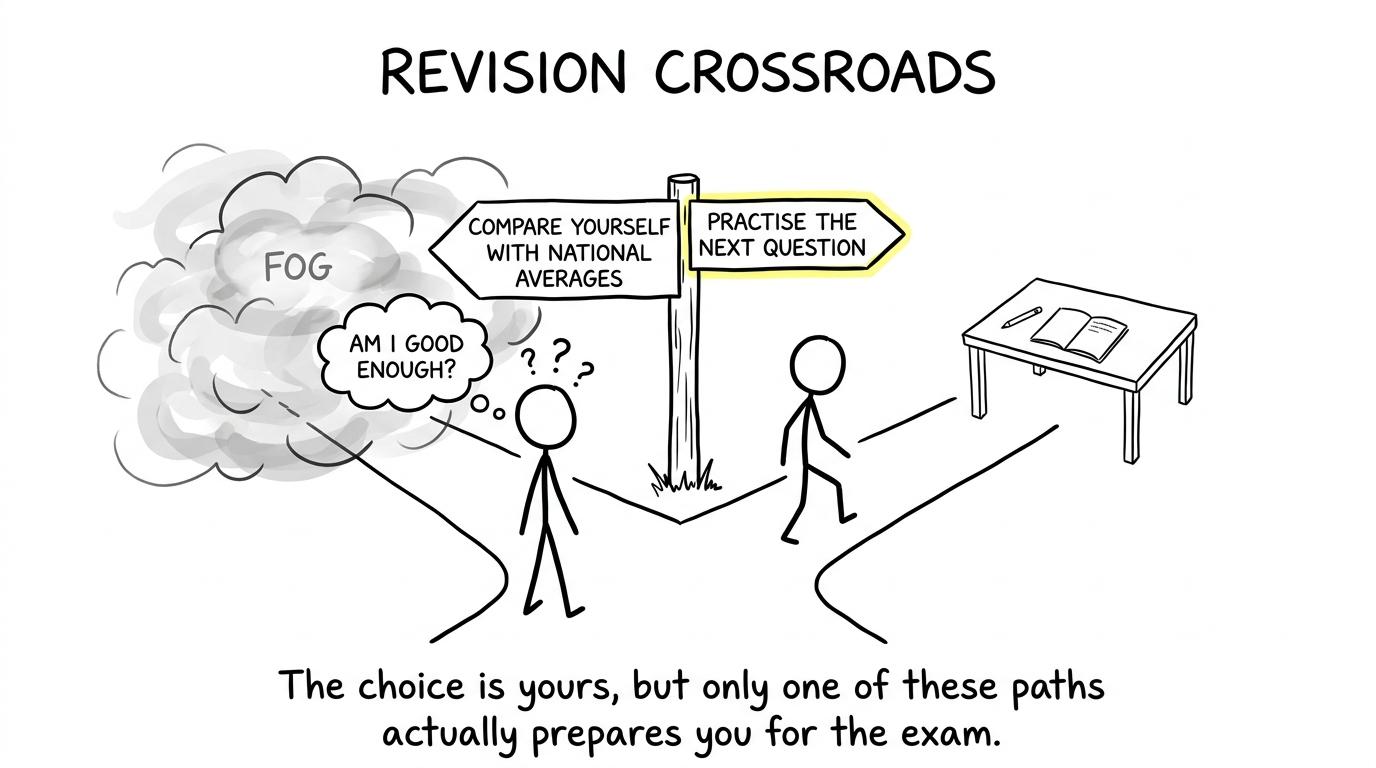 Two revision paths contrast national comparison with practising the next question
Common mistakes when interpreting gender and exam data
Treating a small difference as a universal rule
A group-level gap does not mean every member of one group outperforms every member of another. The national Chemistry distributions overlap heavily, and individual results vary far more than the difference between the headline percentages.
Comparing raw totals instead of rates
Groups with different numbers of entries should normally be compared using proportions. Always ask what number appears in the denominator.
Mixing separate Chemistry with Combined Science
Separate GCSE Chemistry and Combined Science are different qualifications with different entry populations and grading structures. Their results should not be merged casually.
Confusing percentage points with percentages
Subtracting two percentages gives a difference in percentage points. Percentage change requires division by the original value.
Assuming the data proves a cause
Results by sex describe an association. They do not explain whether teaching, prior attainment, entry selection or another factor produced it.
Comparing years without checking cohort changes
A year-on-year movement may reflect changing entry patterns as well as performance. Ofqual highlighted this issue when discussing the fall in separate-science entries in 2025.
For broader exam preparation, GCSE maths topics that come up every year can help you prioritise dependable skills rather than reacting to a single statistic or prediction.
The conclusion the data supports
The 2025 national data does not show a substantial GCSE Chemistry attainment divide between male and female entries. Female entries held a small lead at grade 777 or above, male entries held a tiny lead at grade 999, and outcomes at grade 444 or above were virtually equal.
The most responsible conclusion is therefore modest: small differences exist at particular thresholds, but sex alone is a poor guide to an individual result. National figures describe cohorts. Your next grade is built much closer to home: one corrected mistake, one properly marked paper and one repeated skill at a time.
Start at the free MathsGenie GCSE Maths revision centre. Choose your exam board and tier, rebuild weak topics with revision lessons, then use practice questions, mark schemes and video solutions to check your understanding. Finish with mini tests, past papers and predicted papers under timed conditions. Data can describe last year’s candidates. Focused practice can still change what happens on your paper.