Exam Anxiety GCSE Statistics: A Practical Guide
Exam anxiety GCSE Statistics advice: build calm routines, practise data questions, use past papers wisely and recover calmly when your mind goes blank.
The paper opens. There is a large table, an unfamiliar context and several lines asking you to interpret what the data means. You may know the topic, yet your mind suddenly feels empty.
Managing exam anxiety GCSE Statistics students experience is not about forcing every nervous feeling to disappear. It is about making the next action obvious: identify the question type, select the relevant information, show a method and interpret the result in context. Topic-by-topic revision, realistic paper practice and a rehearsed recovery routine can make that sequence feel familiar even when you are nervous.
Statistics can trigger particular anxiety because questions combine calculations, diagrams, written interpretation and unfamiliar real-life settings. The answer is therefore not generic encouragement. You need preparation that matches the subject.
Your GCSE Statistics anxiety checklist
Use this short checklist before changing your entire revision routine:
- Confirm your exam board, tier and specification.
- Separate knowledge gaps from anxiety-driven mistakes.
- Revise statistics in small, named topic blocks.
- Practise interpreting results as well as calculating them.
- Learn your calculator functions before the examination.
- Move gradually from untimed questions to timed papers.
- Rehearse what you will do if your mind goes blank.
- Ask for support when anxiety is affecting daily life.
Begin at the GCSE Statistics revision hub, where you can choose the relevant exam board and find free revision material, questions and papers.
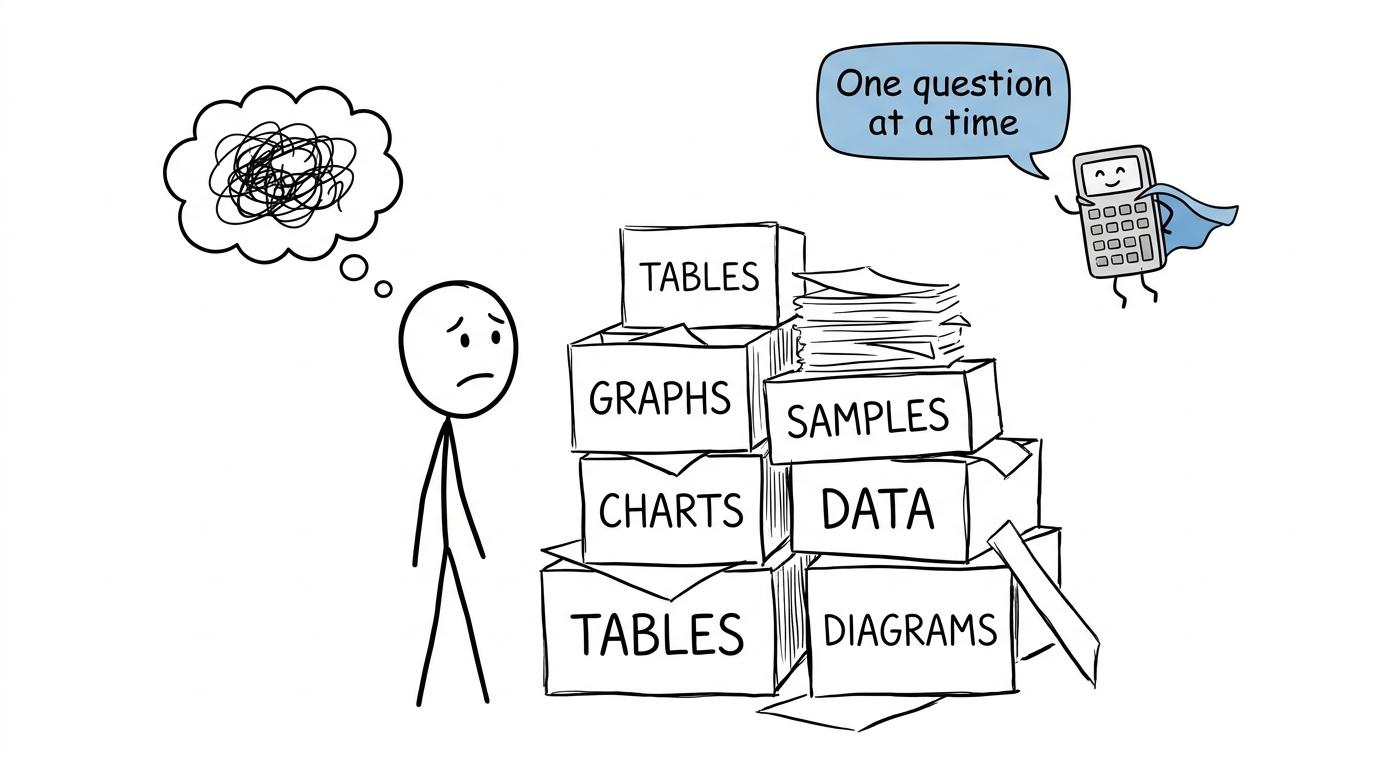 A nervous statistics student receives one-question-at-a-time advice from a calculator wearing a cape
Why GCSE Statistics can feel unusually stressful
A calculation question often gives you a recognisable destination. A Statistics question may first ask you to decide which method is appropriate. You might need to distinguish between a population and a sample, choose a suitable diagram, compare two distributions or judge whether a conclusion is justified.
That uncertainty can create the thought, “I do not know what this question wants.” The thought is not always evidence that you lack the knowledge. Sometimes you have not yet practised recognising the structure beneath the context.
Reduce that uncertainty by sorting revision into four families:
- Collecting data: populations, samples, sampling methods, questionnaires, bias and reliability.
- Processing data: averages, measures of spread and calculations involving tables.
- Representing data: charts, histograms, cumulative frequency graphs, box plots and scatter diagrams.
- Interpreting data: comparisons, conclusions, limitations and the statistical enquiry cycle.
Check your own specification rather than assuming every board or tier assesses identical content. GCSE Statistics qualifications such as AQA and Edexcel use Foundation and Higher tiers, but assessment details and question styles differ. Students encountering statistics within GCSE Maths should likewise check their board and tier. The GCSE topics by exam board and tier guide can help you organise that check.
Turn vague worry into a statistics revision map
“Revise Statistics” is too broad to be a useful instruction. It leaves your brain facing an undefined task, which can intensify avoidance. Replace it with something observable, such as:
- identify bias in sampling questions;
- interpret two box plots in context;
- choose an appropriate average;
- explain why an estimate is only an estimate;
- read class boundaries accurately;
- evaluate a conclusion from collected data.
Create three columns in your revision planner: secure, needs practice and not yet understood. Place each topic according to evidence from questions, not according to how familiar its title looks.
For example, you might recognise frequency tables but still lose marks when finding the total frequency or explaining an estimated mean. Use the averages from frequency tables revision guide to review the idea, then answer questions without looking at the method.
A focused session can follow this cycle:
- review one revision lesson;
- answer a short set of practice questions;
- check the mark scheme;
- record the precise reason for every lost mark;
- repeat the weak skill after a gap.
This matches current official exam-pressure guidance, which recommends manageable, time-limited targets followed by testing and review. The important feature is not the exact length of the session. It is that the task has a clear finish line.
Diagnose lost marks instead of judging yourself
A disappointing score can feel like proof that you are “bad at Statistics”. It is usually more useful to treat the paper as data.
Sort each lost mark into one of these categories:
- Knowledge: you did not know the definition, fact or method.
- Selection: you knew several methods but chose the wrong one.
- Accuracy: you made an arithmetic, graph-reading or calculator error.
- Interpretation: you calculated correctly but did not answer in context.
- Exam behaviour: you rushed, misread an instruction or left the answer unclear.
The category determines the repair. A knowledge gap needs a lesson. A selection error needs mixed questions. An interpretation error needs practice using the variables and units from the question. A rushing error needs a checking routine rather than another hour of note-making.
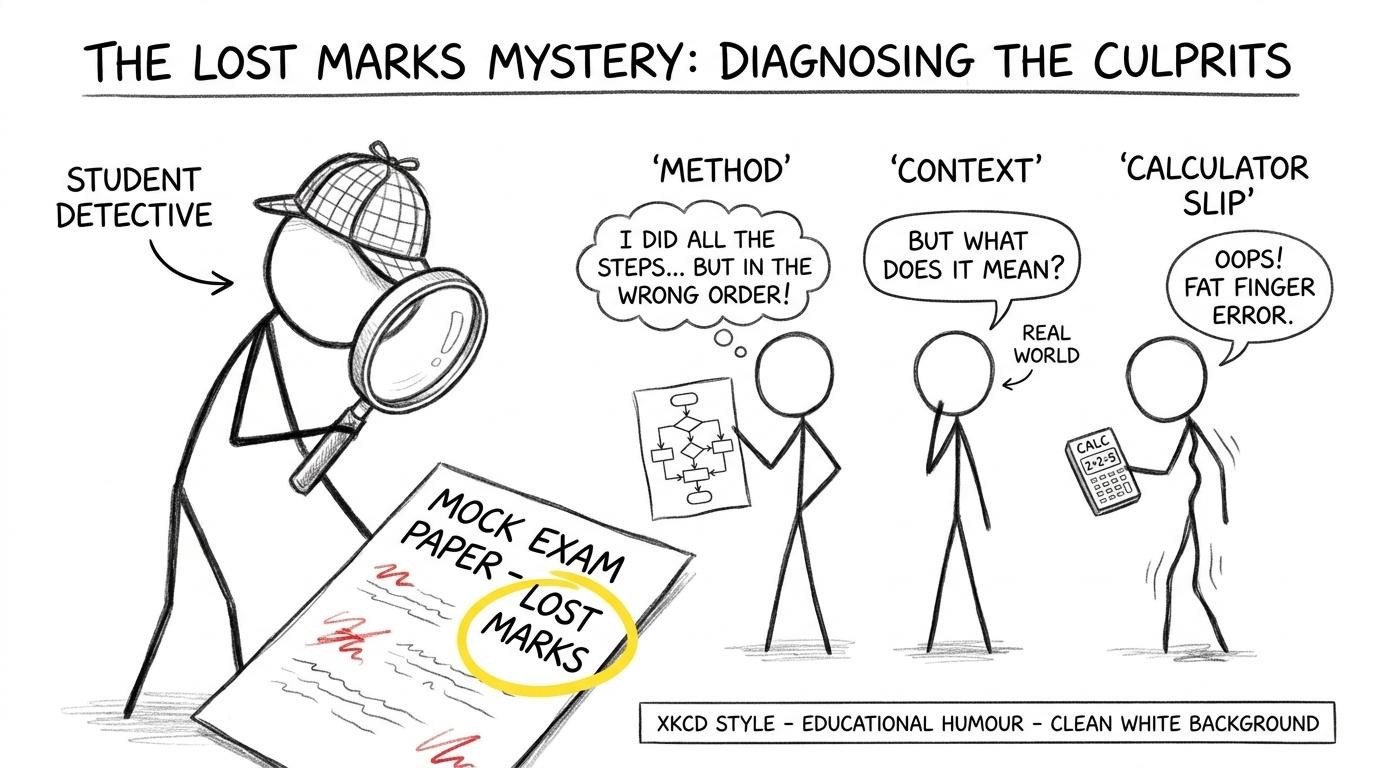 A student detective investigates Method, Context and Calculator Slip as suspects behind lost marks
Practise the parts of Statistics that anxiety disrupts
Build a question-recognition habit
Before calculating, pause and label the demand in a few words: compare distributions, evaluate sampling, calculate spread or interpret correlation. Underlining the command word and circling the relevant variables can stop a long context from controlling your attention.
For graph topics, revise the visual conventions until they become automatic. In a histogram, for example, frequency is represented by bar area rather than simply by height. The histograms revision guide is useful for reviewing frequency density and class width without trying to relearn the whole course at once.
For distribution questions, use the box plots revision guide and cumulative frequency revision guide to strengthen the connection between median, quartiles and spread.
Practise written interpretation deliberately
Students often revise calculations because they feel easier to check. Yet GCSE Statistics also rewards reasoning in context. Practise completing prompts such as:
- “The first group has a higher typical value because…”
- “The second group is more consistent because…”
- “This sampling method may be biased because…”
- “The conclusion is not fully supported because…”
Do not memorise these as complete answers. Use them as structures, then refer to the actual variables, values, units and context. Correlation questions also require careful language: a relationship does not automatically prove causation. The scatter graphs revision resources can help you practise recognising trends and making sensible estimates.
Make the calculator familiar
A calculator should reduce effort, not create another source of uncertainty. Check that you can enter brackets, powers, roots and fractions accurately, clear an incorrect entry and interpret the display. If statistical functions are relevant to your course, ask your teacher which functions you are expected to understand and how results should be shown.
Do not hide all working because the calculator produced an answer. Written stages can earn method marks and give you something concrete to check when anxiety makes you doubt the result.
Use timed practice without feeding panic
Starting immediately with full papers can make anxiety worse if your knowledge is still fragmented. Build exposure gradually:
- answer one topic question without a timer;
- complete a short mixed set;
- attempt one timed paper section;
- complete a full paper under realistic conditions;
- mark it and repair the weakest areas.
The Edexcel GCSE Statistics revision area includes lessons, questions, worksheets and papers that can support this progression. Students on other boards should select their board through the main Statistics hub.
Past papers are not verdicts on your future grade. They are rehearsals. Early attempts should help you understand question language and mark-scheme expectations. Later attempts can develop timing and stamina. Keep some papers unseen so that your final practice remains realistic.
After each paper, track raw marks and error types. Avoid turning every score into an unofficial predicted grade, because grade boundaries vary between series. Your most useful question is simpler: “Which repair would recover the greatest number of marks next time?”
What to do when anxiety rises in the exam
Official guidance from Ofqual and the NHS recommends slow breathing, careful reading, realistic planning and moving on temporarily when you become stuck. Rehearse this Statistics-specific reset:
- Put both feet on the floor and relax your shoulders.
- Breathe slowly for several cycles.
- Read only the current sentence, not the entire page.
- Identify the data type, command word and required output.
- Write one relevant fact, label or method.
- If you remain stuck, leave space and return later.
For a graph, begin by checking axes, scales and units. For a table, locate headings and totals. For an interpretation question, name the variables and decide whether the evidence concerns centre, spread, association, bias or reliability.
This is not wasted time. A brief reset can prevent several rushed errors. If you need practical help, such as replacement equipment or clarification of examination instructions, raise your hand and speak to the invigilator. They cannot explain the Statistics, but they can deal with permitted practical issues.
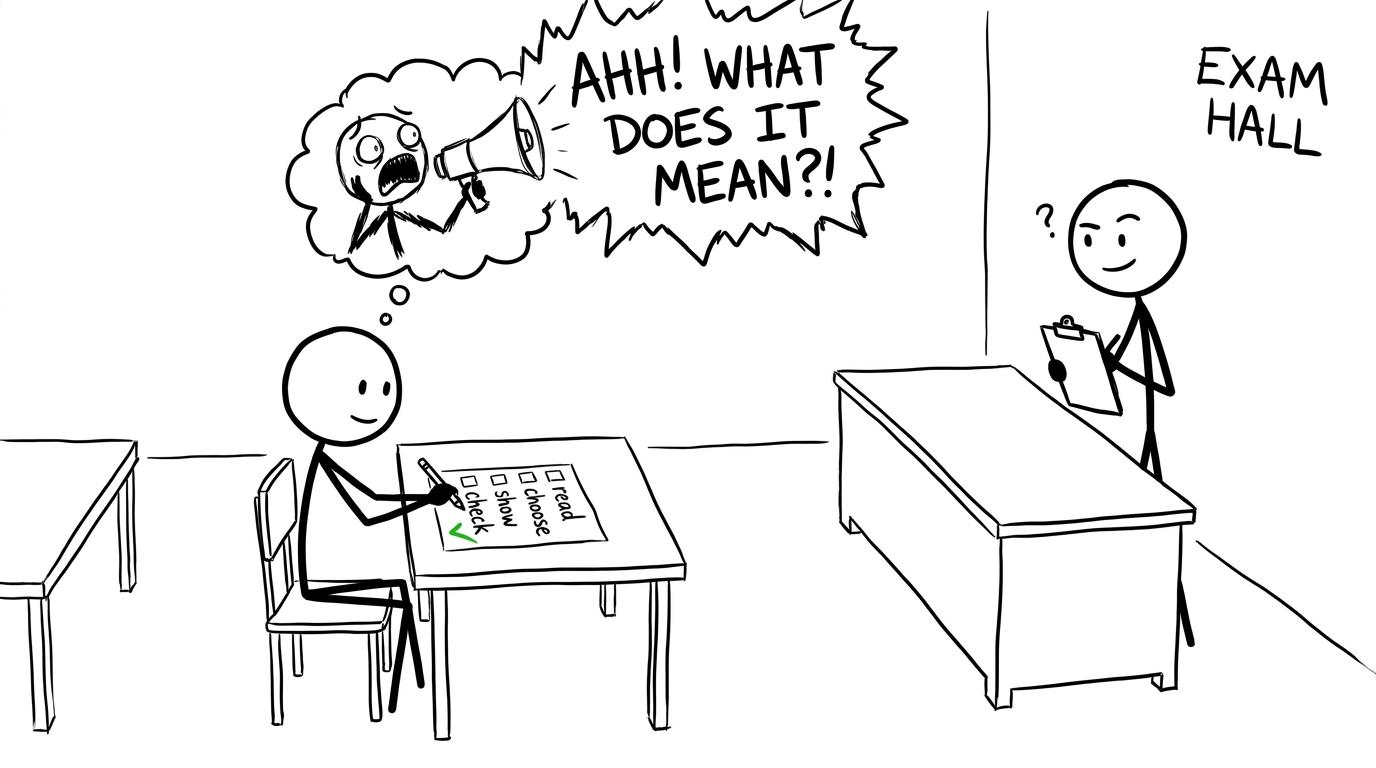 A calm student follows a read, choose, show and check routine while a panic cloud protests
Common mistakes when managing GCSE Statistics anxiety
Avoiding the most uncomfortable topics
Repeating familiar averages may feel productive while sampling, histograms or statistical enquiry remain untouched. Begin sessions with a small amount of your weakest topic, then finish with something more secure.
Revising definitions without applying them
Knowing what “stratified sample” or “interquartile range” means is only the first stage. You must recognise when the concept is relevant and explain results in context.
Completing papers without reviewing them
A marked score alone teaches very little. Use mark schemes and video solutions where available, correct each error and reattempt difficult questions after several days.
Treating one difficult question as evidence about the whole paper
Statistics papers contain varied topics. One unfamiliar context does not mean every later question will be equally difficult. Move on, collect accessible marks and return with a calmer perspective.
Ignoring persistent anxiety
Some nervousness before an examination is common. However, if anxiety is severe, persistent, causes panic, disrupts sleep or eating, or interferes with everyday life, tell a trusted adult, teacher, pastoral lead or GP. Revision advice is not a substitute for mental health support.
Make your next step smaller and clearer
Confidence in GCSE Statistics rarely arrives before practice. It grows from evidence: you recognised the diagram, selected a method, explained a limitation or recovered after getting stuck.
Choose one weak topic today. Use a MathsGenie revision lesson, complete focused practice questions and check the mark scheme. Then place a mini test, past paper section or predicted paper into your revision planner. As the examination approaches, use full past papers, video solutions and realistic timing to make the experience familiar.
Start with the free MathsGenie GCSE Statistics resources. You do not need to feel perfectly calm before beginning. You only need a clear next question and a reliable way to learn from it.