Thermal radiation and energy balance

EasyMedium
12345678910111213141516171819202122232425262728293031
Question 30
Easy

An engineer investigates the infrared emission from two heated ceramic plates, X and Y. The graph shows how the intensity of the emitted radiation varies with wavelength for both plates.
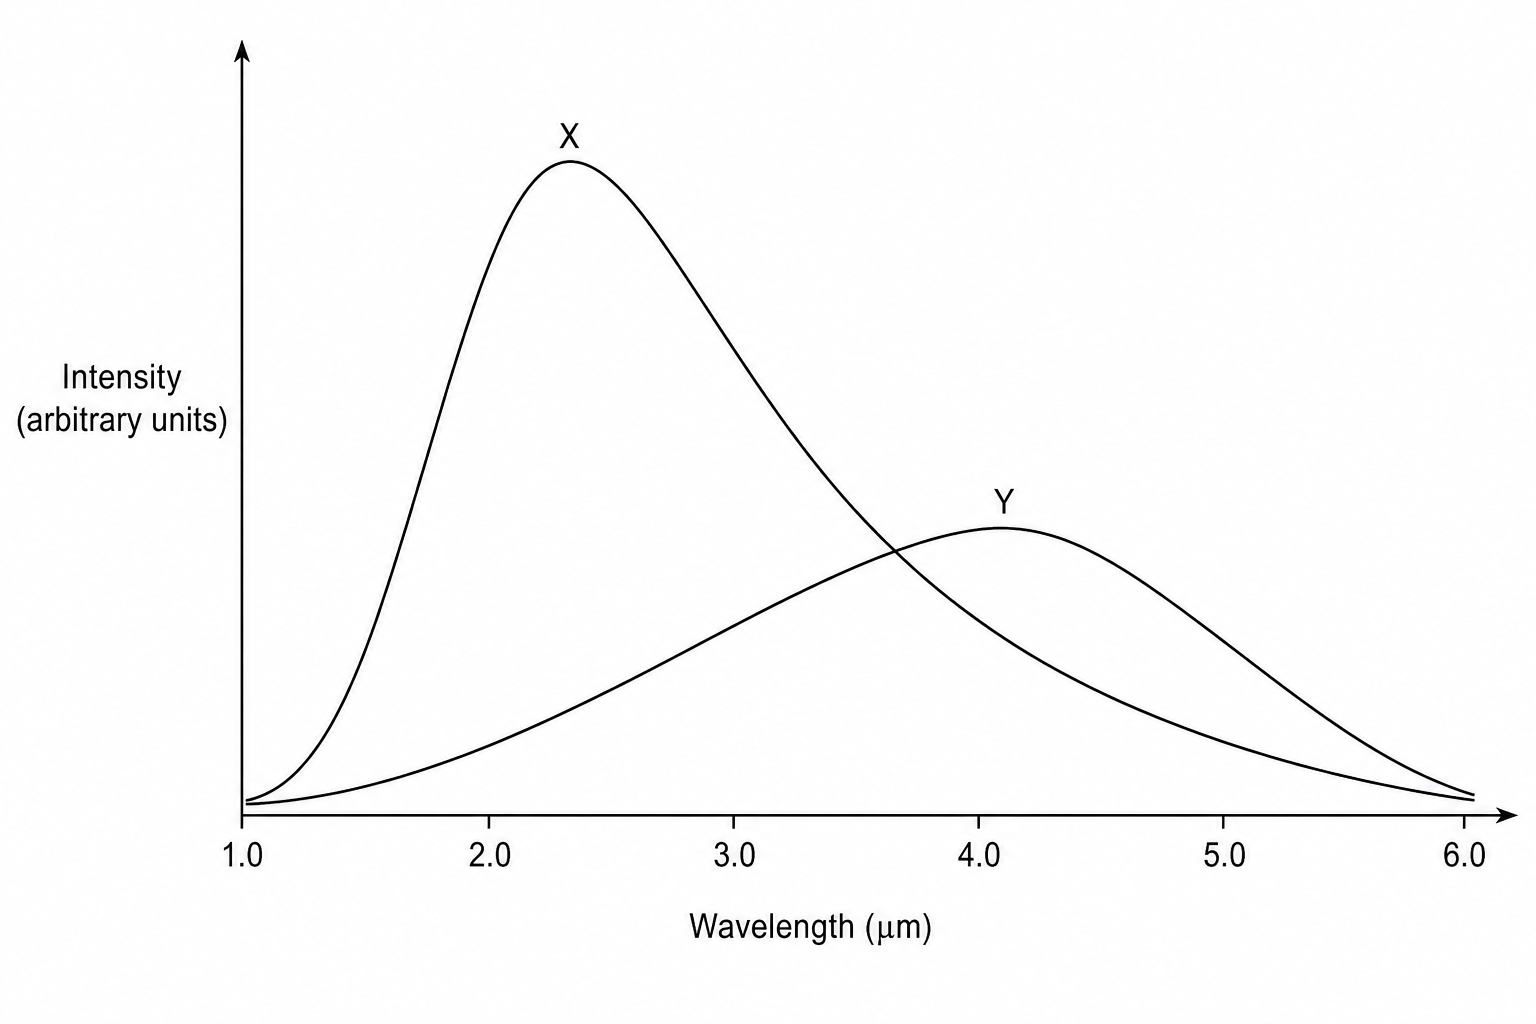
Graph of emission intensity versus wavelength in micrometres (μm) for two heated plates, X and Y. The x-axis (wavelength) ranges from 1.0 to 6.0 μm. Curve X has a higher peak intensity which occurs at a shorter wavelength of 2.5 μm. Curve Y has a lower peak intensity which occurs at a longer wavelength of 4.0 μm.

State, with a reason, which plate is at the higher temperature.

[2]

Thermal radiation and energy balance Questions

  1. GCSE
  2. /Physics
  3. /Thermal radiation and energy balance