Thermal radiation and energy balance

EasyMedium
12345678910111213141516171819202122232425262728293031
Question 7
Easy

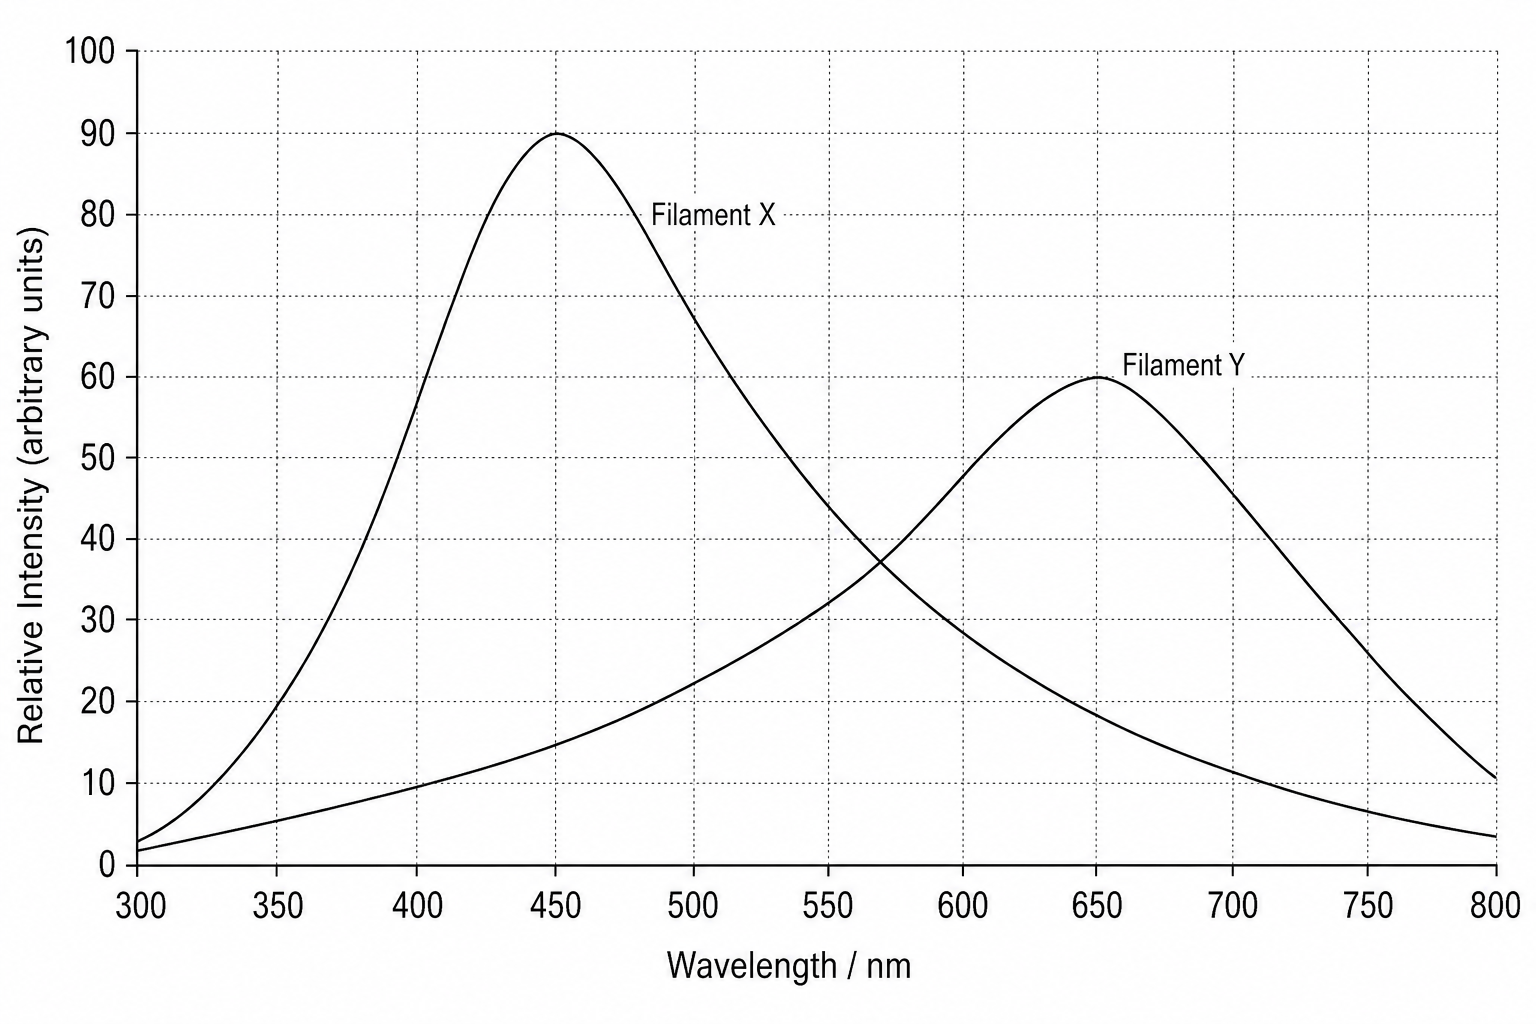
Figure 1 shows the emission intensity against wavelength for two glowing metal filaments, X and Y.

A graph showing curves of relative intensity versus wavelength in nanometres (nm) for two glowing filaments, X and Y. The horizontal axis (wavelength) ranges from 300 nm to 800 nm with grid markings every 50 nm. Curve X starts near 300 nm, rises steeply to a maximum peak at exactly 450 nm, and then declines back down towards 800 nm. Curve Y starts near 300 nm, rises more gradually to a maximum peak at exactly 650 nm, and then declines towards 800 nm. The vertical axis represents Relative Intensity (arbitrary units).

Estimate the wavelength at which the emission intensity is at a maximum for each filament.
[2]

Thermal radiation and energy balance Questions

  1. GCSE
  2. /Physics
  3. /Thermal radiation and energy balance