Thermal radiation and energy balance

EasyMedium
123456789101112131415
Question 11
Medium

An industrial metal heating element emits electromagnetic radiation as its temperature changes.

Figure 1 shows how the intensity of the emitted radiation varies with wavelength for two different temperatures, T1 T_1\,T1​ and T2T_2T2​ (where T2 T_2\,T2​ is higher than T1T_1T1​).

The visible light region of the electromagnetic spectrum is shaded between 400 nm and 700 nm.
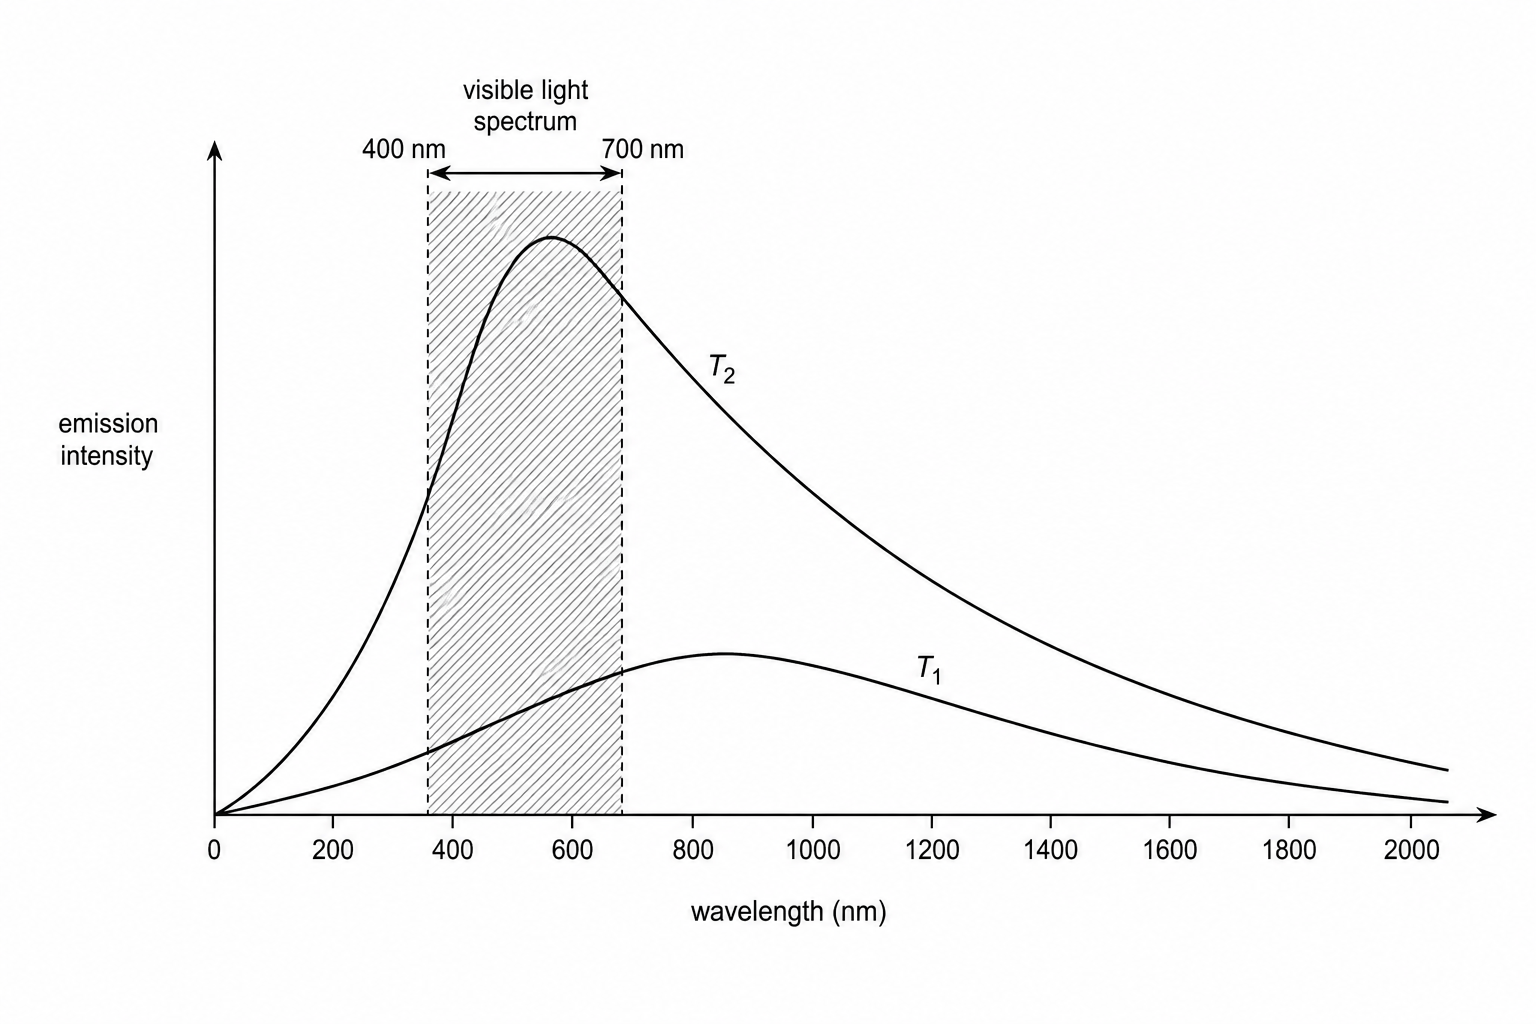
A graph plotting Emission Intensity on the vertical axis against Wavelength in nanometres (nm) on the horizontal axis. The visible region is marked from 400 nm to 700 nm. Two curves are shown: Curve T1, representing a lower temperature, has its peak at a longer wavelength around 850 nm (in the infrared region) and a relatively low overall intensity. Curve T2, representing a higher temperature, has a much higher peak shifted to a shorter wavelength around 550 nm (inside the visible region), with much higher intensity across all wavelengths than Curve T1.

Explain why the heating element appears much brighter and changes from a dull red to a yellow-white color as its temperature increases from T1 T_1\,T1​ to T2T_2T2​.

[4]

Thermal radiation and energy balance Questions

  1. GCSE
  2. /Physics
  3. /Thermal radiation and energy balance