Thermal radiation and energy balance

EasyMedium
12345678910111213141516171819202122232425262728293031
Question 29
Easy

Two identical metal cans are filled with equal volumes of hot water at 80 ∘C80\space^\circ\text{C}80 ∘C and allowed to cool in a draft-free room.

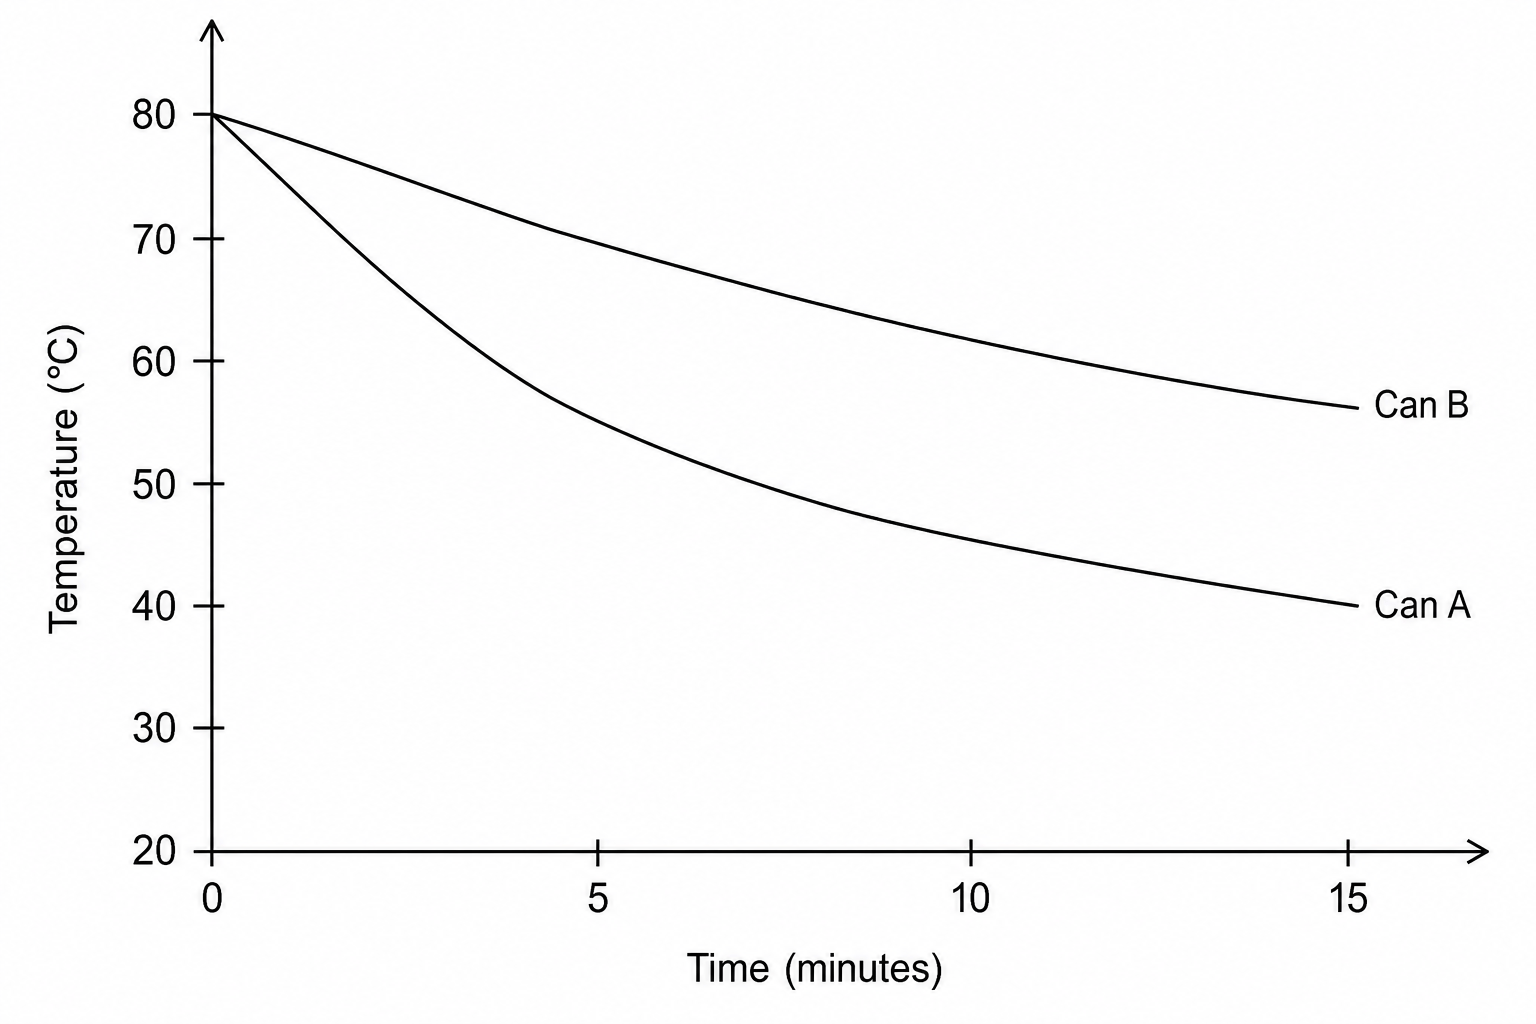
Figure 1 shows the experimental setup. Figure 2 shows a graph of their temperature over time.
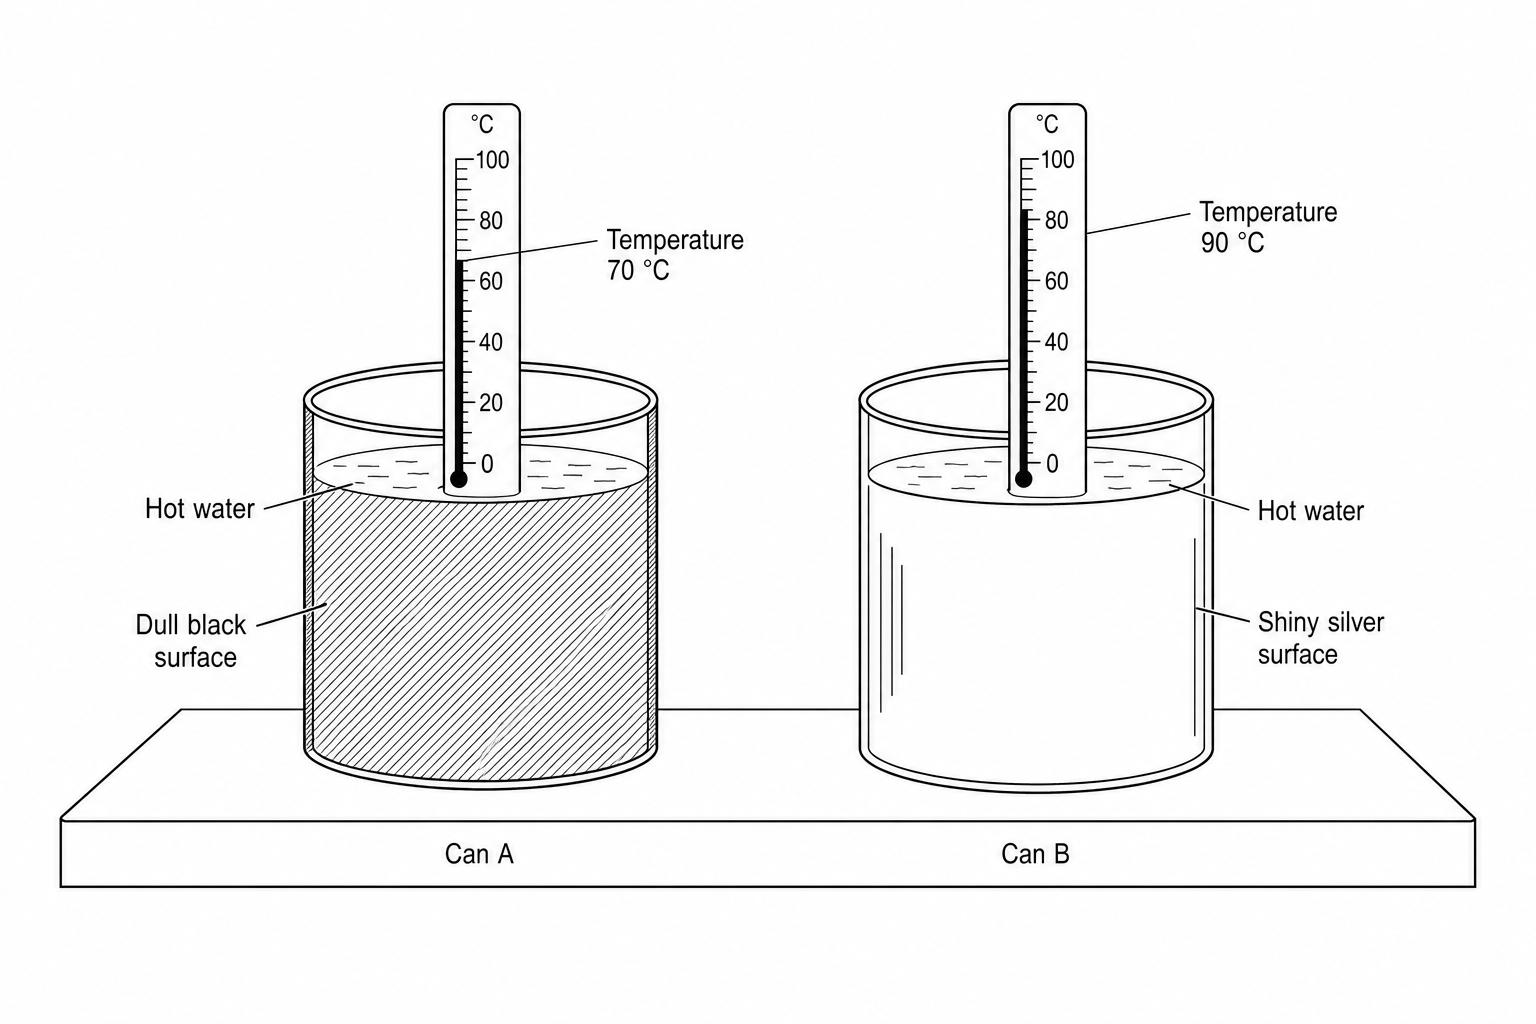
Figure 1: Two identical metal cans, Can A and Can B, each filled with hot water and fitted with a thermometer. Can A has a dull black outer surface. Can B has a shiny silver outer surface.

Figure 2: A line graph showing temperature on the y-axis (from 20 to 80 degrees Celsius) against time in minutes on the x-axis (from 0 to 15). The curve for Can A starts at 80 degrees Celsius and decreases steeply, reaching 40 degrees Celsius at 15 minutes. The curve for Can B starts at 80 degrees Celsius and decreases more gradually, reaching 55 degrees Celsius at 15 minutes.

Explain why the curve for Can A is different from the curve for Can B. Use ideas about thermal radiation to help your answer.

[2]

Thermal radiation and energy balance Questions

  1. GCSE
  2. /Physics
  3. /Thermal radiation and energy balance