An astrophysicist monitors the radiation emitted by the surface of a variable protostar as it contracts and heats up.
Figure 1 shows how the spectral radiance of the emitted electromagnetic radiation varies with wavelength for two different surface temperatures, TA T_A\,TA and TBT_BTB (where TB T_B\,TB is higher than TAT_ATA).
The visible light region of the electromagnetic spectrum is shaded between 0.4 μm0.4\ \mu\text{m}0.4 μm and 0.7 μm0.7\ \mu\text{m}0.7 μm.
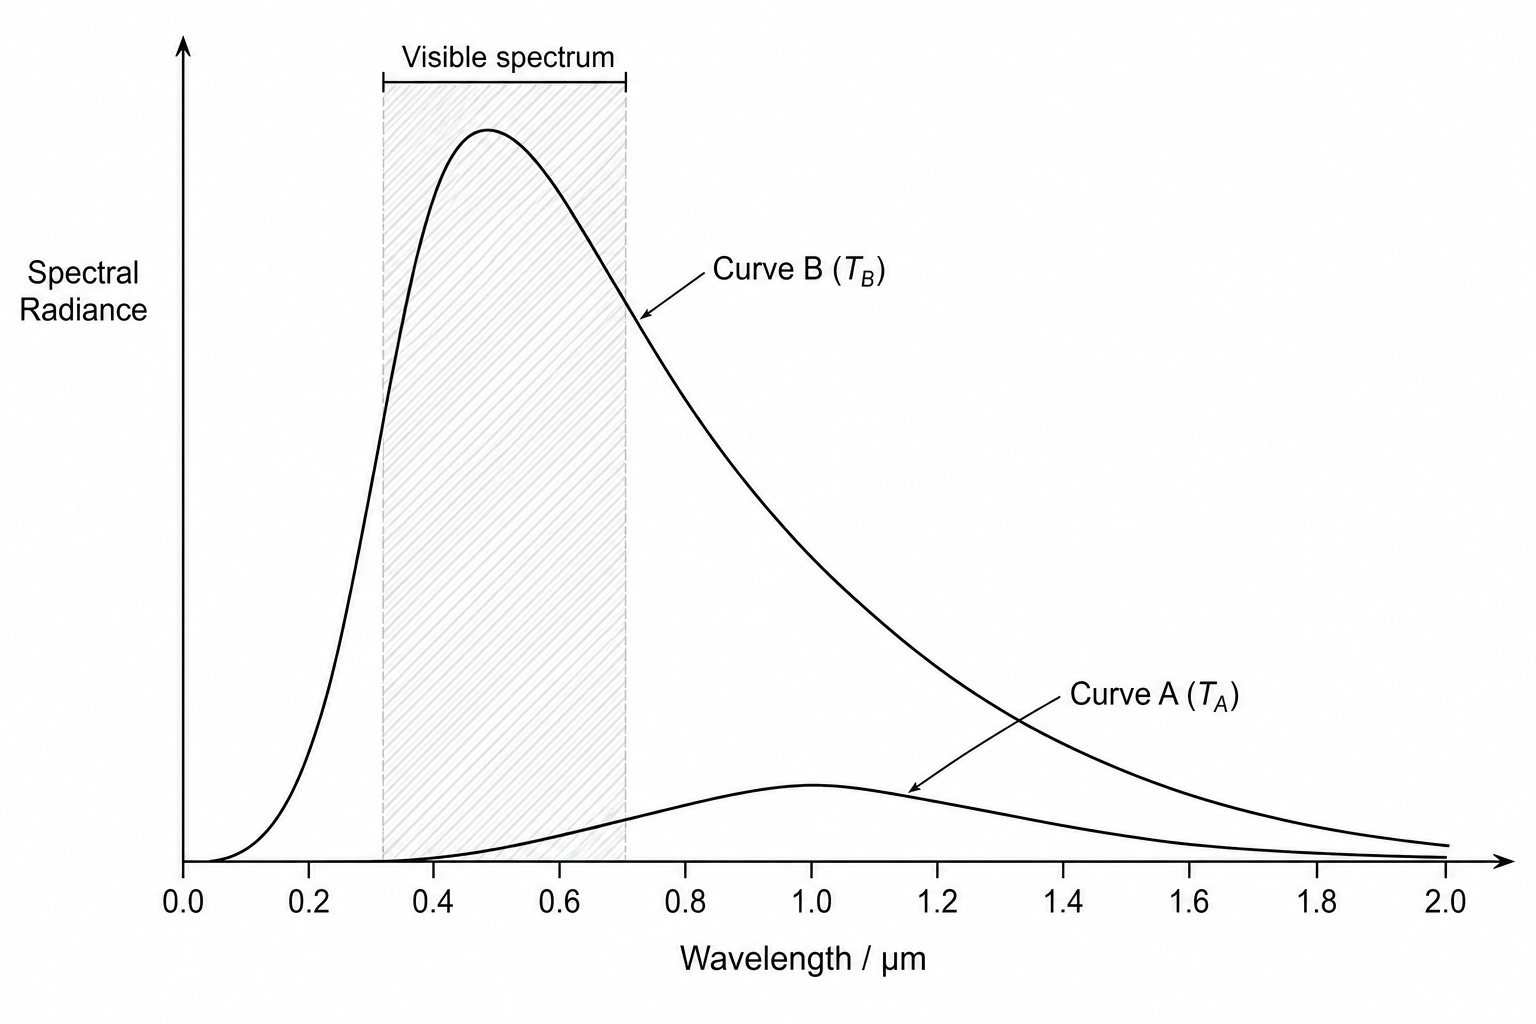
Explain why the protostar appears much brighter and shifts from a dim, deep-red colour to a brilliant blue-white colour as its surface temperature increases from TA T_A\,TA to TBT_BTB.