The graph in Figure 1 shows how the vertical velocity, v m/sv\text{ m/s}v m/s, of a medical delivery drone changes during a 60-second test flight. The graph is divided into several sections, including four labelled sections: W, X, Y, and Z.
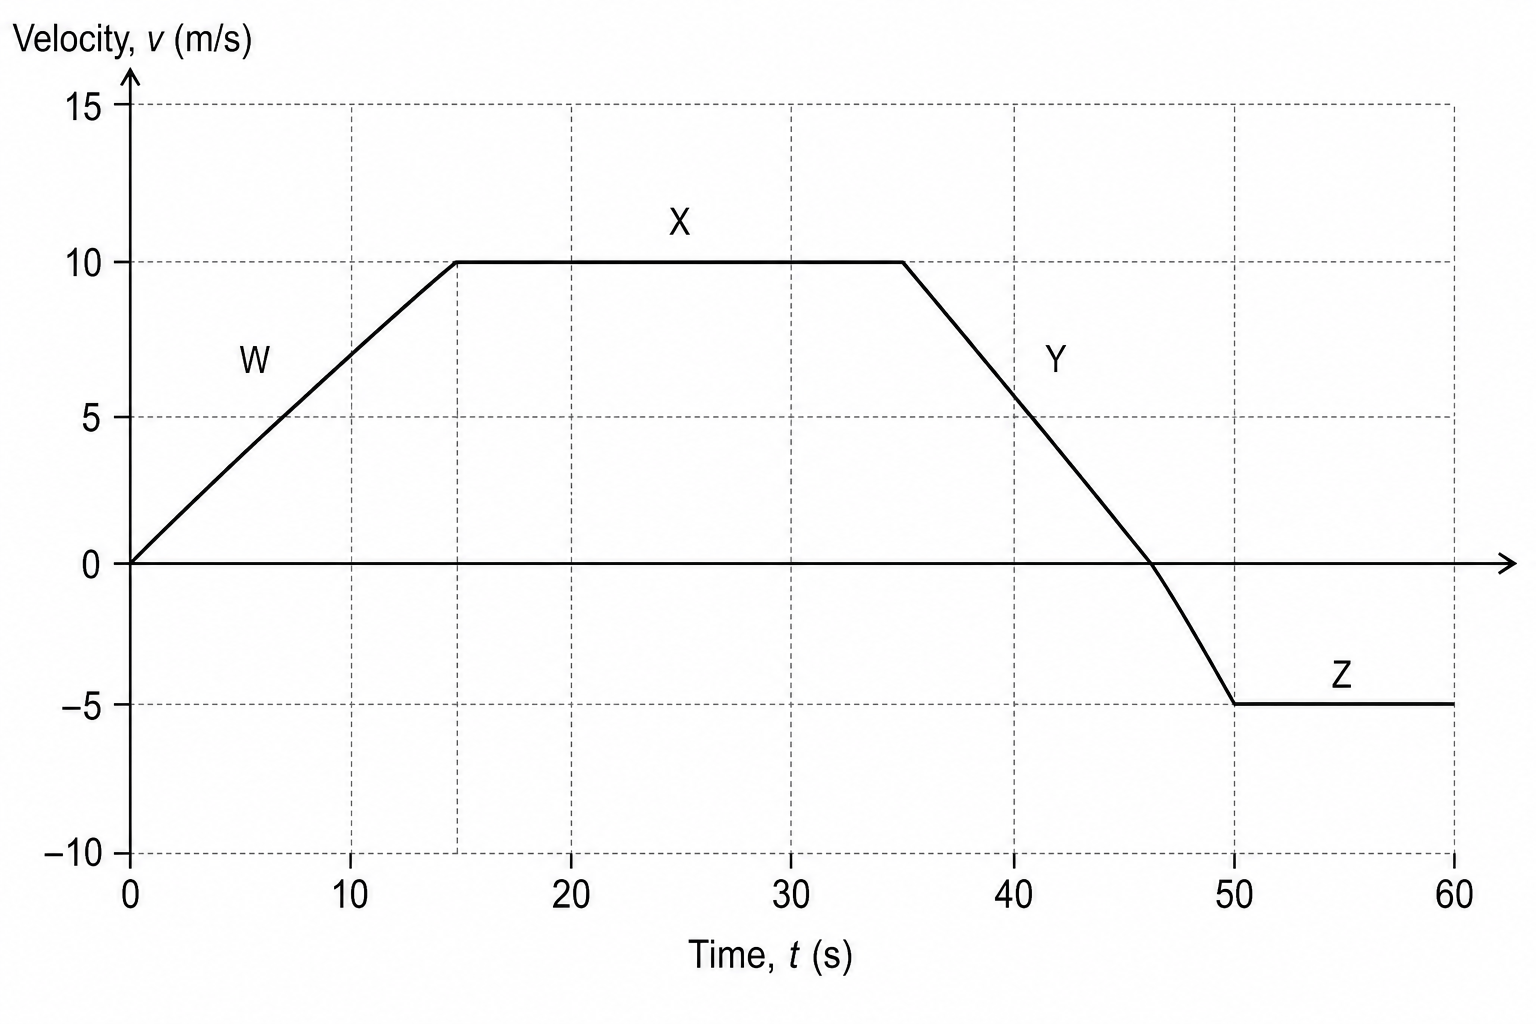
Match each section of the graph to the correct description of the drone's motion.
One has been done for you:
- Section W is matched to: the drone is accelerating upwards
Match the remaining three sections (X, Y, and Z) to their correct descriptions from the list below:
- the drone is descending at a constant speed
- the drone is decelerating while ascending
- the drone is ascending at a constant speed