Speed, velocity and acceleration

EasyMediumHard
12345678910111213141516171819202122232425262728293031323334353637383940414243444546474849505152535455565758
Question 55
Easy

An engineer monitors the speed of a prototype autonomous heavy-cargo drone during its horizontal takeoff run.

The results are shown in the graph below.
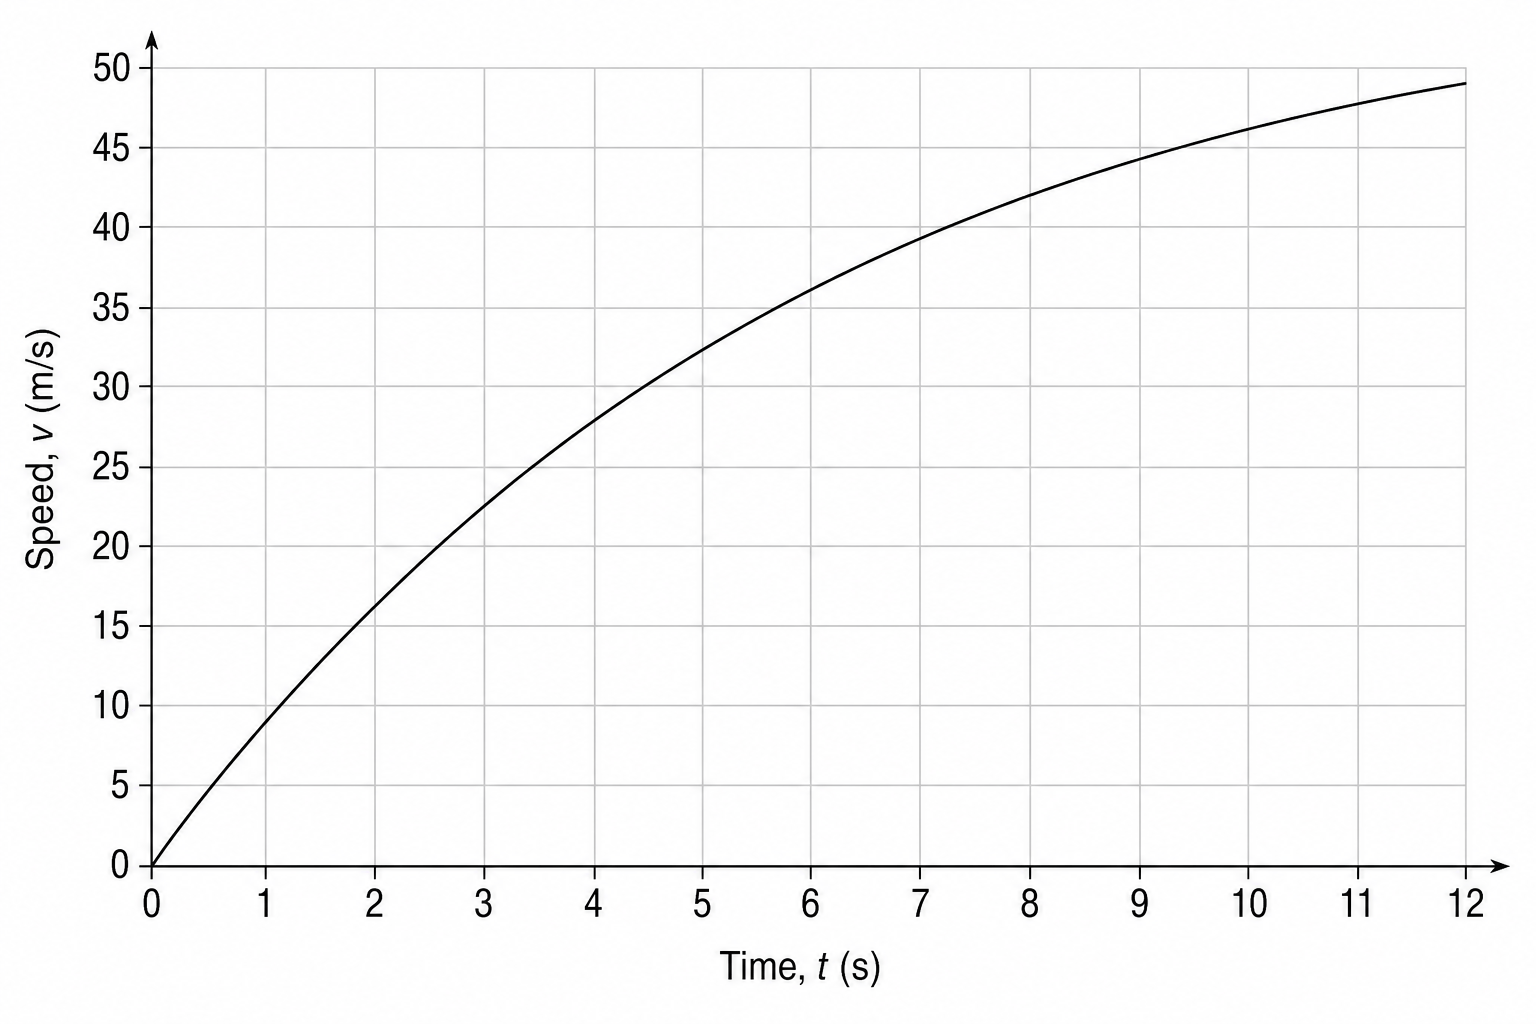
A line graph showing the speed v of a heavy-cargo drone in m/s on the vertical y-axis against time t in seconds on the horizontal x-axis. The y-axis ranges from 0 to 50 m/s with grid lines every 5 m/s. The x-axis ranges from 0 to 12 s with grid lines every 1 s. A smooth curve with decreasing gradient starts at (0,0) and passes through (2, 16), (4, 28), (6, 36), (8, 42), and (10, 46).

Describe how the speed of the drone varies with time between t=2.0 st = 2.0\text{ s}t=2.0 s and t=10.0 st = 10.0\text{ s}t=10.0 s.

[2]

Speed, velocity and acceleration Questions

  1. GCSE
  2. /Physics
  3. /Speed, velocity and acceleration