Speed, velocity and acceleration

EasyMediumHard
12345678910111213141516171819202122232425262728293031323334353637383940414243444546474849505152535455565758
Question 53
Easy

A delivery van travels along a straight road. Figure 1 shows the velocity-time graph for its journey.
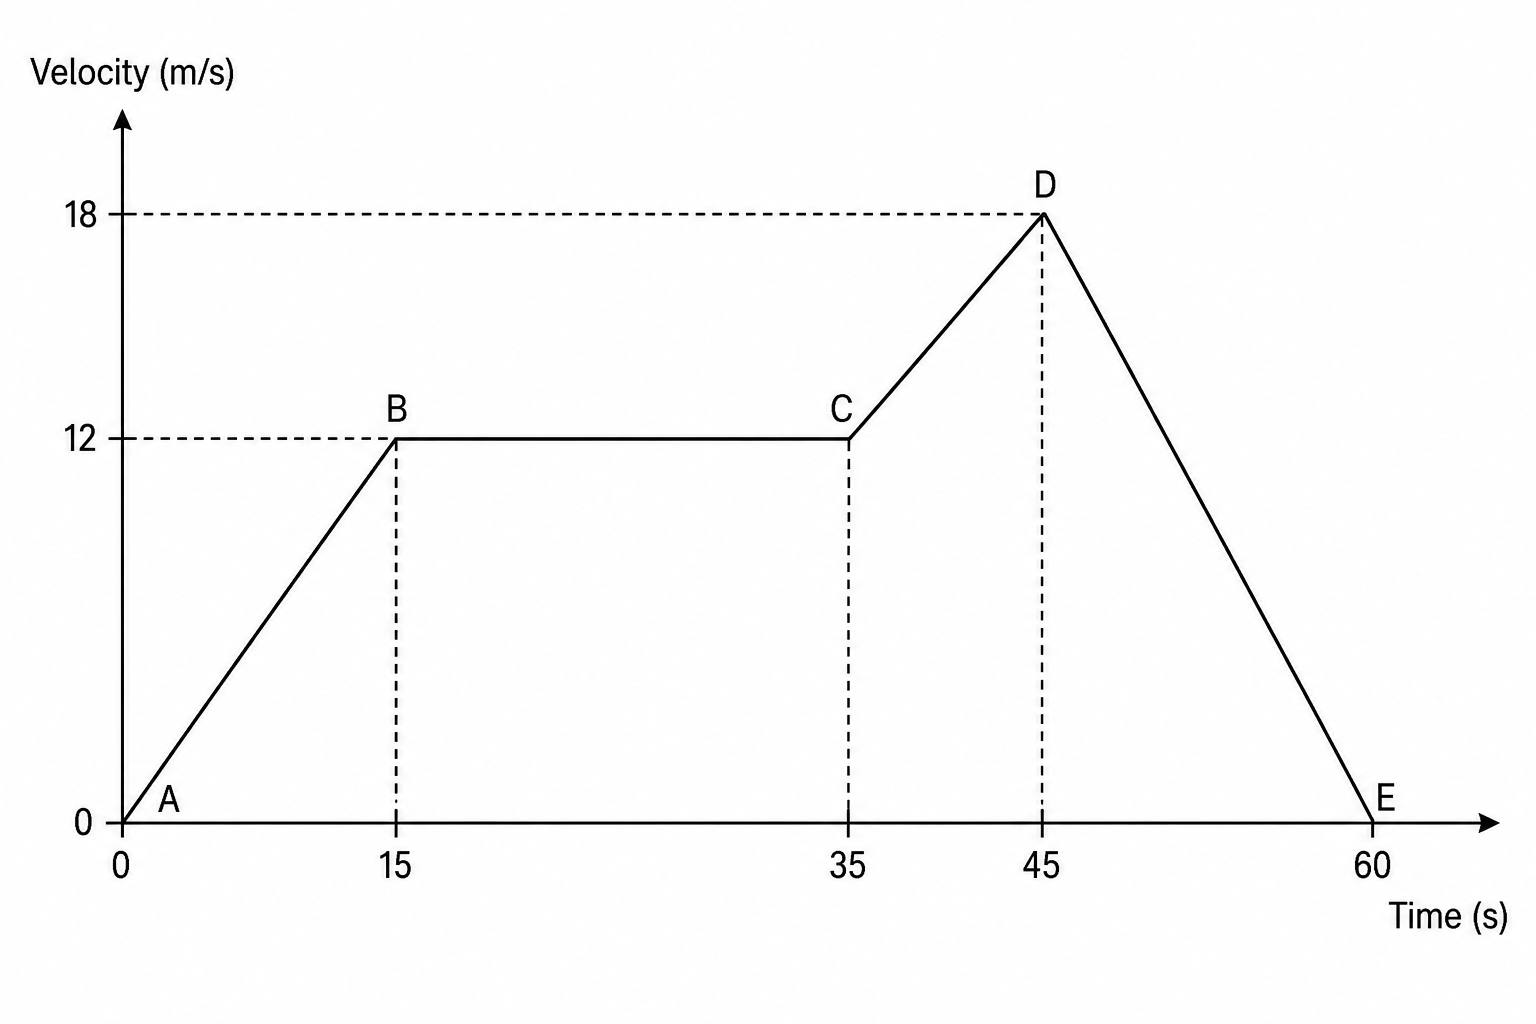
Velocity-time graph for a delivery van. The y-axis shows velocity in m/s with key values marked at 0, 12, and 18. The x-axis shows time in seconds with key division points at 0, 15, 35, 45, and 60. The graph has four segments: AB is a straight line from (0,0) up to (15, 12); BC is a horizontal line from (15, 12) to (35, 12); CD is a straight line from (35, 12) up to (45, 18); DE is a straight line from (45, 18) down to (60, 0).

Calculate the distance the delivery van travels during the part of the journey represented by section BC.

[3]

Speed, velocity and acceleration Questions

  1. GCSE
  2. /Physics
  3. /Speed, velocity and acceleration